What Is Latency and What Is Throughput?
When people talk about system performance, two words appear everywhere: latency and throughput. They sound similar, but they describe completely different things. Understanding both is essential for data engineers who design APIs, databases, or streaming pipelines.
Latency is the time it takes for a single operation to finish from start to end. It measures responsiveness and is often expressed in milliseconds or seconds. Throughput is the amount of work a system can complete in a given period. It measures capacity and is expressed in units such as requests per second (RPS), transactions per second (TPS), or megabytes per second (MB/s).
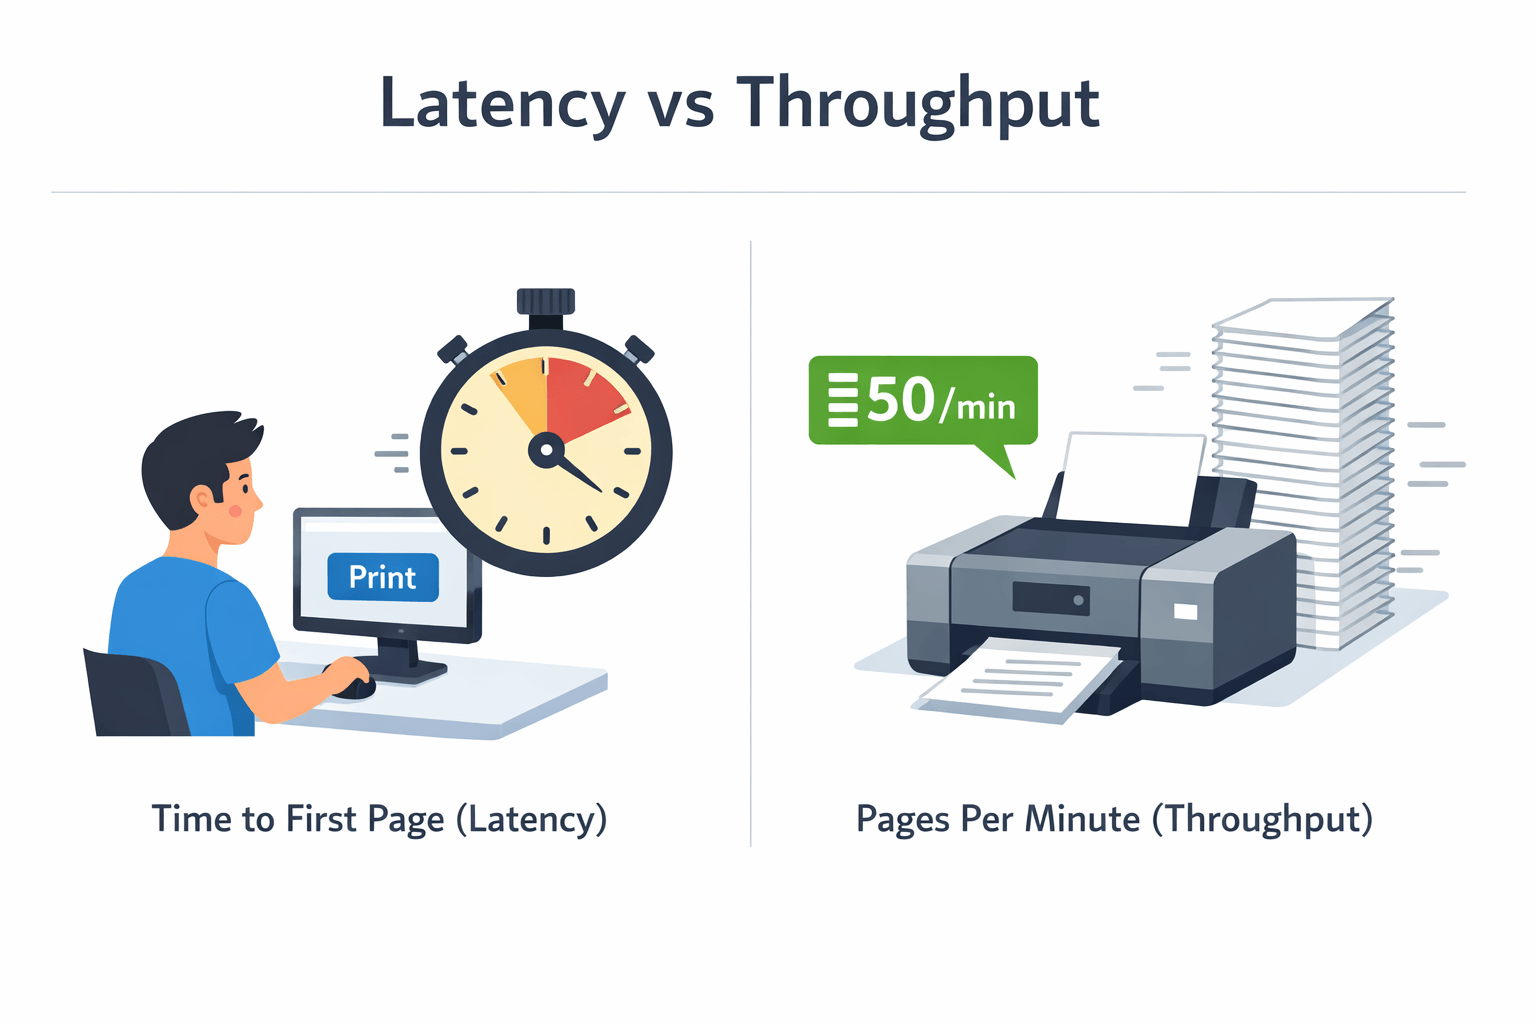
Latency is the time from clicking Print to getting the first page. Throughput is how many pages the printer outputs per minute. A fast office printer may take a few seconds to warm up (latency), but then prints 40 pages/min (high throughput). A small home printer might start immediately (low latency) but prints slowly overall (low throughput).
For data engineers, balancing latency and throughput determines how responsive and scalable systems feel to end users. Real-time analytics, online services, and batch jobs all depend on choosing the right balance between these two metrics.
Key Takeaways
Latency measures how quickly a single request completes.
Throughput measures how much total work is done over time.
The two metrics are related through Little’s Law, which connects work in progress, throughput, and latency.
High throughput can increase latency if concurrency or batching is not managed.
Some low-latency choices can cap throughput, such as avoiding batching, limiting concurrency, or doing extra round-trips to keep per-request work small.
Always track percentile latency (p95 or p99) alongside throughput to catch hidden performance issues.
The right balance depends on workload type: real-time APIs value latency, while batch jobs value throughput.
Latency vs Throughput: Meaning, Units, and Metrics
To understand how systems perform, engineers use latency and throughput as two sides of the same coin. Each tells a different story about efficiency and capacity.
Latency measures time per task. It shows how long it takes for one operation to complete, from the moment a request is made to the moment the response is delivered.
- Units: milliseconds (ms) or seconds (s)
- Common metrics: average latency, median (p50), and high-percentile values such as p95 and p99 that reveal worst-case performance.
- Example: If an API takes 200 milliseconds to return a response, its latency is 200 ms.
Throughput measures work over time. It indicates how many operations a system can complete within a given duration.
- Units: requests per second (RPS), transactions per second (TPS), rows per second, or megabytes per second (MB/s).
- Example: A data pipeline processing 10,000 records every second has a throughput of 10,000 records per second (or events/messages per second).
Latency focuses on how quickly a single request finishes, while throughput focuses on how many requests the system can handle overall. In real-world systems, you cannot improve one indefinitely without affecting the other, which leads to the throughput-latency trade-off discussed in the next section.
How Latency and Throughput Relate: The Trade-off
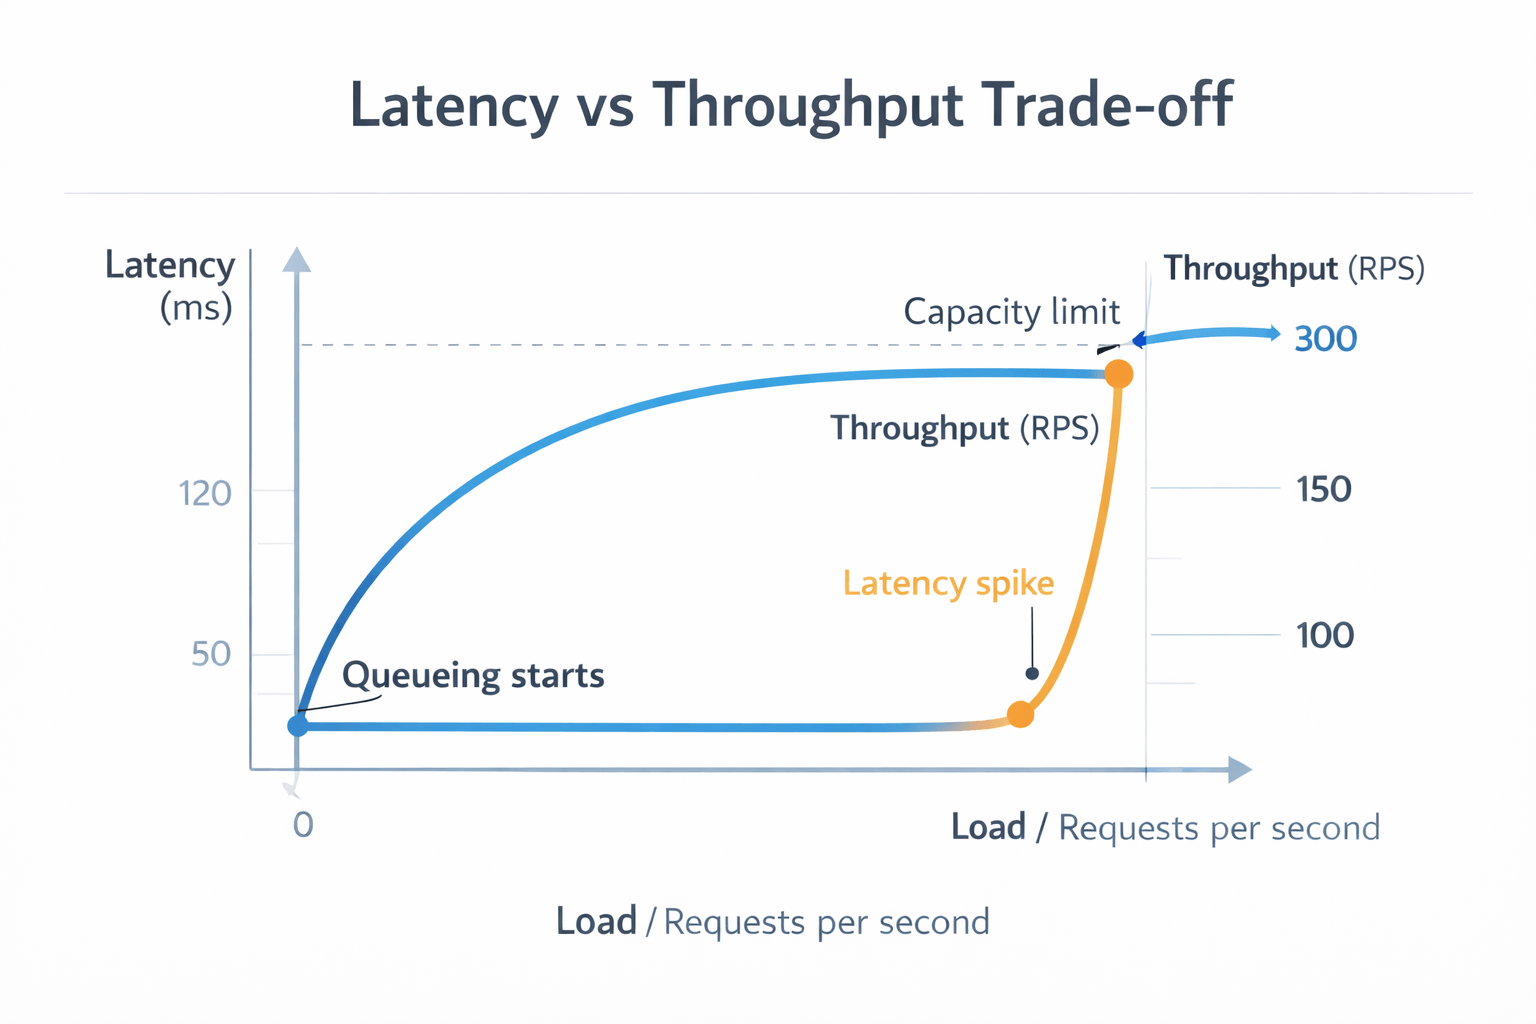
Latency and throughput are connected through capacity and queueing. When a system has spare capacity, you can often improve both by removing bottlenecks (faster I/O, fewer network hops, better queries). But as load approaches the system’s limits, queueing grows, and latency can rise quickly even if throughput stays high.
A key way to reason about this relationship is Little’s Law, which applies to stable systems in steady state and uses long-run averages:
Work in progress = Throughput × Average time in system
- WIP (work in progress) is the average number of requests, messages, or tasks in the system (running or waiting).
- Average time in system includes both waiting time (queueing) and service time (processing).
Little’s Law explains why latency often increases when you drive a system harder without increasing capacity. If throughput is near its limit and more work arrives, WIP increases (more backlog), and the average time in system increases (more waiting).
In practical terms:
- Increasing throughput often involves higher concurrency, parallelism, or batching. These can raise total capacity, but they can also increase waiting time if they create larger queues or contention for shared resources (CPU, locks, disk, network).
- Reducing latency often means doing less work per unit (smaller batches, fewer hops, less contention). That can improve responsiveness, but it may reduce efficiency and cap maximum throughput if overhead per operation becomes dominant.
The right balance depends on the workload. User-facing APIs and real-time analytics typically optimize for low tail latency (p95/p99). Large ETL and warehouse ingestion jobs often accept higher per-record latency in exchange for sustained high throughput.
When to Prioritize Latency vs Throughput
Not every workload needs the same balance between latency and throughput. The key is to identify what your system’s users or processes value most: immediate responsiveness or overall capacity.
When Latency Matters Most
You should optimize for low latency when responsiveness defines user experience or correctness.
Examples include:
- Interactive APIs and microservices: Users expect sub-second responses. High latency feels like lag or timeout.
- Real-time analytics and dashboards: Data freshness affects decision-making, so systems must respond quickly to new inputs.
- Streaming and gaming platforms: Low latency ensures smooth playback or gameplay by minimizing delays.
- Financial transactions and IoT systems: A few milliseconds can influence risk management or sensor-based automation.
In these scenarios, even a small delay can cause visible performance degradation or loss of accuracy. Reducing latency through caching, optimized queries, or edge processing usually brings better results than maximizing throughput.
When Throughput Takes Priority
You should optimize for high throughput when the goal is to process massive volumes of data efficiently, even if results are not instant.
Examples include:
- Batch ETL jobs: Moving terabytes from one database to another benefits from parallelism and bulk writes.
- Data warehouse ingestion: The system’s goal is to load data reliably and at scale, not to respond in milliseconds.
- Backup and replication processes: Completion speed depends on overall data volume, not individual request time.
- Machine learning training pipelines: High throughput allows faster iteration over large datasets.
In these use cases, slightly higher latency per operation is acceptable if it allows the system to handle more data overall.
Balancing Both
Modern distributed systems often aim for a balance. For example, streaming data platforms combine low latency with sustained throughput by using techniques like buffering, partitioning, and backpressure. The balance you choose directly impacts cost, architecture, and user satisfaction.
Measuring Latency and Throughput in Practice
Accurate measurement is the first step toward improving system performance. Latency and throughput can look healthy in isolation but reveal real trade-offs only when tracked together.
Measuring Latency
Latency captures the time it takes for a single operation to complete. Engineers typically measure several key latency metrics to understand real-world performance:
- Average latency: The mean time per request, useful for broad comparisons.
- Median (p50) latency: The time it takes for 50% of requests to complete, which reflects a typical user experience.
- Percentile latency (p95, p99): These show the slowest requests, often called tail latency. Monitoring high percentiles is critical because a small portion of slow responses can degrade overall performance.
Example:
If an API has a median latency of 120 ms and a p99 latency of 800 ms, most requests feel fast, but 1% of users experience noticeable lag.
Tools commonly used:
Prometheus and Grafana commonly track percentiles by recording histograms and computing p95/p99 using histogram_quantile, while Datadog and CloudWatch provide percentile views more directly depending on integration.
Measuring Throughput
Throughput focuses on how many operations a system completes within a fixed period. It reveals capacity rather than speed.
- Common units: Requests per second (RPS), transactions per second (TPS), rows per second, or megabytes per second (MB/s).
- Measurement approach: Track total completed operations over time intervals.
- Example: A data pipeline processing 1 million records per minute has a throughput of ~16,600 records per second.
Tools commonly used:
Kafka metrics, Snowflake’s query performance dashboards, and network monitoring tools such as iperf or Apache JMeter help track throughput under different loads.
Setting SLIs and SLOs
In production environments, organizations define:
- SLIs (Service Level Indicators): Quantitative metrics like p95 latency ≤ 200 ms or throughput ≥ 10,000 RPS.
- SLOs (Service Level Objectives): Agreed performance targets that keep systems dependable and predictable.
By measuring latency and throughput together, you gain visibility into the real health of your systems. A high throughput number means little if latency spikes under peak load, and low latency is meaningless if throughput collapses under scale.
How to Improve Latency and Throughput
Improving latency and throughput often involves different strategies. Both rely on understanding bottlenecks, optimizing architecture, and monitoring trade-offs carefully. The right approach depends on whether your system values fast response or maximum processing capacity.
How to Reduce Latency
Reducing latency focuses on shortening the time between request and response. Techniques include:
- Reduce network distance: Deploy services closer to users or data sources using edge computing or content delivery networks (CDNs).
- Minimize work per request: Optimize queries, compress payloads, or cache frequent responses to avoid repeated computation.
- Eliminate queue buildup: Use load shedding or rate limiting when the system approaches capacity to prevent waiting delays.
- Tune tail latency: Identify outlier requests through percentile metrics and isolate noisy components that cause spikes.
- Parallelize independent work: Break large tasks into smaller pieces that can run concurrently to reduce total response time.
The goal is not just faster averages but predictable, consistent latency across all requests.
How to Increase Throughput
Increasing throughput focuses on allowing more work to be processed over time. Methods include:
- Add parallelism: Scale horizontally by adding workers, partitions, or shards that share load.
- Use batching when acceptable: Combine multiple small operations into one bulk request to reduce overhead, especially in ETL or data ingestion tasks.
- Optimize I/O efficiency: Reuse database connections, apply asynchronous I/O, and minimize protocol overhead.
- Adjust concurrency: Increase the number of concurrent threads or tasks up to the point of resource saturation.
- Profile and remove bottlenecks: Identify slow components such as CPU-bound operations, disk writes, or network latency that limit overall throughput.
Balancing Both
Often, improving one metric negatively affects the other. For example, batching improves throughput but adds waiting time, increasing latency. A balanced design combines both approaches:
- Introduce backpressure so producers slow down when consumers reach limits.
- Choose right-time processing, where data moves at the pace that makes sense for the use case rather than always aiming for real-time.
- Monitor both latency and throughput metrics together to understand system health holistically.
The most efficient systems treat latency and throughput as complementary, not competing, goals.
Estuary: Managing Latency and Throughput in Right-Time Data Pipelines
Modern data systems rarely run at one speed. Some pipelines need sub-second freshness, while others prioritize high-throughput batch movement. Estuary is the Right-Time Data Platform that lets teams move data when they choose (sub-second, near real-time, or batch) so they can balance responsiveness, scale, and cost in one system.
How Estuary helps balance latency and throughput
- Flow control and backpressure: Pipelines stay stable as input rates change, preventing backlogs that turn “real-time” into delayed data.
- Parallel, partitioned execution: Scale throughput by distributing work across partitions while keeping end-to-end behavior predictable.
- Performance-focused CDC connectors: In high-volume CDC, throughput limits often show up as latency (falling behind creates backlog). For example, Estuary optimized its MongoDB capture to reduce idle time via prefetching and improve decode efficiency, increasing sustained throughput (about 34 MB/s to 57 MB/s on ~20 KB docs), which helps pipelines absorb spikes without end-to-end latency creep.
- Exactly-once outcomes where supported: When destinations support transactions or idempotent writes, Estuary is designed to produce exactly-once results; otherwise it provides dependable, well-defined delivery behavior.
With Estuary, teams don’t have to choose between low latency and high throughput. They can run both, at the right time, per workload.
Real-World Impact
For example, a company syncing operational data from PostgreSQL to Snowflake can choose near-real-time movement to keep dashboards current, while another pipeline from S3 to BigQuery might use larger batch intervals for cost efficiency. Both run on the same Estuary platform with dependable latency and consistent throughput.
Estuary gives engineers full control over the performance trade-offs that matter most. Instead of choosing between high throughput or low latency, they can achieve both at the right time for each workload.
Real-World Examples
Understanding the latency and throughput conceptually is useful, but seeing them in real systems makes the distinction clearer. The following examples show how these metrics behave in different contexts.
Example 1: API Response Times
A public API receives thousands of requests per second.
When requests are processed sequentially, each one completes in about 200 milliseconds, but the system can only handle 5 requests per second.
When engineers introduce asynchronous processing and horizontal scaling, throughput increases to 500 requests per second.
However, if concurrency grows too high, requests start queuing and latency rises to 800 milliseconds.
This scenario demonstrates how higher throughput can unintentionally increase latency if not managed with proper limits or backpressure.
Example 2: File Transfer and Network Bandwidth
A cloud storage service transfers files over a 100 Mbps link.
The latency (round-trip time) of 10 milliseconds defines how long it takes for a single packet to be acknowledged.
The throughput measures how much data can be moved per second.
Increasing the TCP window size or running multiple parallel streams can raise throughput without changing the baseline RTT, but under congestion it can increase queueing delay, which shows up as higher end-to-end latency. This example shows that latency and throughput can be tuned independently, depending on network parameters.
Example 3: Streaming Data Pipelines
In a data streaming architecture, producers publish messages faster than consumers can process them.
Without backpressure, messages queue up in memory, inflating end-to-end latency until the system crashes or drops data.
When backpressure is enabled, throughput stabilizes at the consumer’s maximum rate, keeping latency predictable and data consistent.
Platforms like Estuary enforce flow control and backpressure so throughput stays stable and end-to-end latency remains predictable as input rates fluctuate.
Example 4: Database Ingestion Jobs
A data engineering team runs nightly ETL jobs to load terabytes of data into a warehouse.
Latency per record is relatively high, but the system achieves massive throughput through batching and parallel writes. This setup is ideal because timeliness is less critical than total volume processed.
Each scenario shows the same pattern: latency defines responsiveness, throughput defines capacity, and both must be managed together for dependable performance.
Cheat Sheet: Latency vs Throughput
This quick reference summarizes the key concepts and tuning strategies that data engineers should remember when evaluating or optimizing system performance.
| Concept | Definition | Measurement Units | When It Matters Most | How to Improve |
|---|---|---|---|---|
| Latency | The time it takes for one operation or request to complete from start to finish | Milliseconds (ms) or seconds (s) | Real-time systems, APIs, dashboards, streaming analytics | Cache responses, reduce hops, use parallelism, eliminate queues |
| Throughput | The total amount of work a system completes over time | Requests per second (RPS), Transactions per second (TPS), Rows per second, MB/s | Batch jobs, data ingestion, backups, ML training | Add concurrency, batch operations, optimize I/O, scale horizontally |
| Relationship | Throughput × Latency = Work in Progress (Little’s Law) | — | Always relevant when balancing load and responsiveness | Use backpressure and flow control to maintain equilibrium |
| Trade-off | Under load, batching and higher concurrency can increase queueing and raise latency. Some low-latency choices (smaller batches, stricter limits) can cap throughput. Removing bottlenecks can improve both. | — | When optimizing for cost, performance, or reliability | Monitor both metrics and find the right-time balance |
| Monitoring Tools | Prometheus, Grafana, Datadog, AWS CloudWatch, Kafka metrics, JMeter | — | All system types | Define SLIs and SLOs to track p95 latency and sustained throughput |
Quick Recap
- Latency = responsiveness, how fast a single task completes.
- Throughput = capacity, how much total work the system performs over time.
- The two are connected through system design, resource limits, and queuing behavior.
- Tools and observability are essential for maintaining the right balance.
- In right-time systems like Estuary, you can control both together instead of treating them as conflicting goals.
Conclusion
Latency and throughput define how every system performs, from APIs and cloud networks to data pipelines and streaming platforms. Latency captures responsiveness, or how quickly a single task completes, while throughput captures capacity, or how much total work can be done in a given time.
In real-world architectures, both metrics influence each other. A system that maximizes throughput without managing latency risks slow responses and timeouts. One that focuses only on latency may waste capacity. The key is to balance them according to your use case and service goals.
Modern right-time platforms like Estuary make this balance easier by letting you choose when and how fast data moves. Whether you need sub-second updates or large-volume transfers, Estuary ensures dependable performance without forcing trade-offs.
FAQs
Can a system have high throughput but high latency?
Why does latency increase when traffic increases?
What is tail latency and why do p95 and p99 matter?
Does batching increase throughput or latency?

About the author
Team Estuary is a group of engineers, product experts, and data strategists building the future of real-time and batch data integration. We write to share technical insights, industry trends, and practical guides.

