A real-time dashboard is an essential tool for any team that relies on up-to-the-minute data to make fast, confident decisions. From monitoring product usage and sales activity to tracking IoT devices or operational KPIs, real-time dashboards provide instant visibility into what’s happening across your systems.
This guide will show you how to build a real-time dashboard from scratch, covering everything from data ingestion and transformation to live visualization using scalable tools like Estuary. You’ll learn how to capture data from source systems the moment it changes, move it through a real-time data pipeline, and surface it in a user-friendly dashboard interface.
Unlike traditional report-based BI dashboards that update on a fixed schedule, real-time dashboards are powered by streaming data pipelines. They continuously process incoming events and reflect them on-screen within seconds, enabling real-time decision-making and proactive responses.
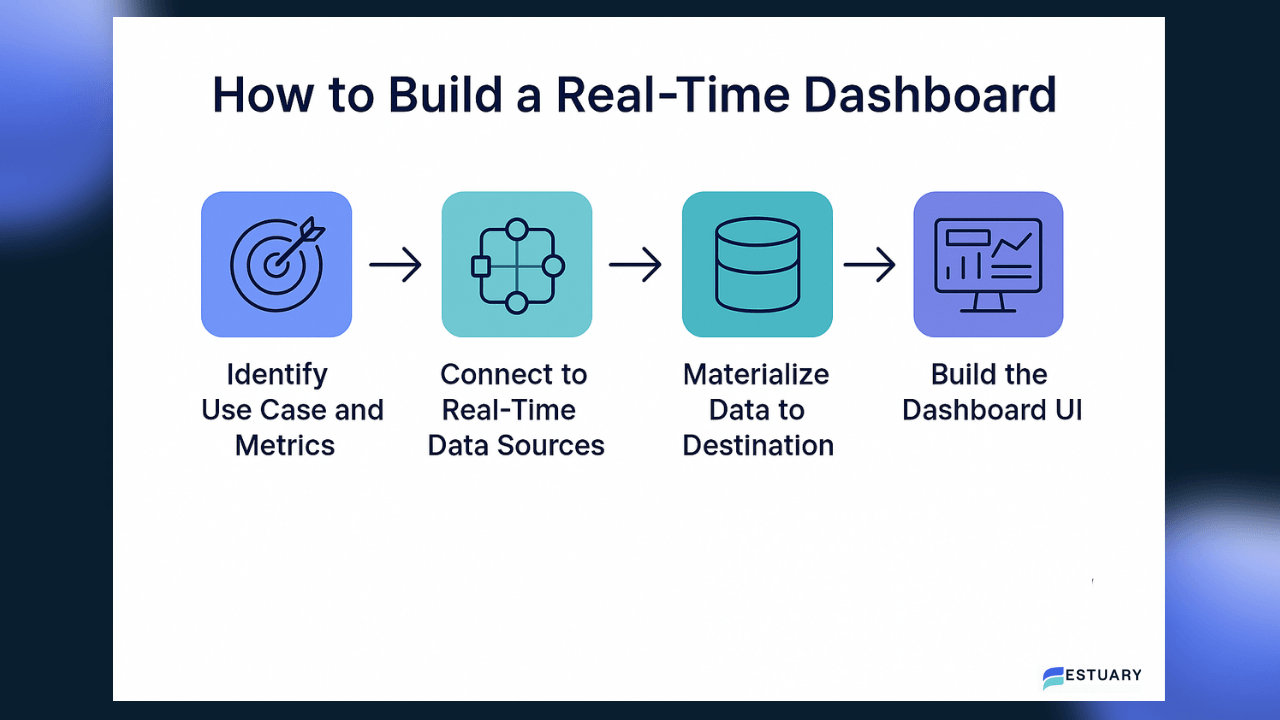
To achieve this, you'll need to:
- Capture data from real-time sources
- Transform and model it for downstream use
- Materialize it to a dashboard-compatible destination
- Visualize it in a fast, interactive UI
Estuary simplifies this process by giving you a powerful, fully managed platform for streaming data integration. With native support for change data capture (CDC), automated schema evolution, and dozens of source/destination connectors, Estuary is a production-ready backbone for your real-time analytics stack.
Key Components of a Real-Time Dashboard
Before you start building, it’s important to understand what makes up a real-time dashboard under the hood. A well-designed system relies on a seamless flow of data from source to screen, and each part of the architecture plays a critical role.
Here are the core components you’ll need to build a real-time dashboard:
1. Real-Time Data Sources
These are the systems generating the data you want to visualize. Common examples include:
- Transactional databases (e.g., PostgreSQL, MySQL, MongoDB)
- SaaS applications (e.g., Shopify, HubSpot, Stripe)
- Event streams (e.g., Kafka, webhooks)
- IoT devices or log aggregators
Your pipeline begins by capturing changes from these systems the moment they happen, typically using Change Data Capture (CDC) or event subscriptions.
2. Real-Time Data Pipeline
This is the infrastructure that streams data from source to destination with low latency. Tools like Estuary are purpose-built for this layer, enabling continuous data capture, in-flight transformations, and automatic delivery to multiple sinks.
Estuary acts as a central nervous system that ingests real-time data, validates schemas, and routes updates efficiently to analytics platforms or storage systems.
3. Storage or Analytical Destination
Where your real-time data lands depends on what kind of analysis you want to perform. Popular options include:
- Data warehouses: BigQuery, Snowflake, Redshift
- OLAP databases: ClickHouse, MotherDuck
- Streaming platforms: Kafka, Apache Pulsar
- Operational DBs: PostgreSQL, MySQL
Estuary’s materialization connectors make it easy to push data into these systems in near real-time.
4. Visualization Layer
This is where your users see the live data. Dashboards are typically built with tools like:
- Grafana – ideal for time series and system metrics
- Apache Superset – open-source and SQL-friendly
- Metabase – simple, fast, and user-friendly
- Looker, Power BI, Tableau – for more advanced or enterprise-grade setups
These tools connect to your destination system and display charts, KPIs, and alerts that update automatically as new data flows in.
5. Optional: Orchestration and Alerting
While not always required, teams often layer in tools to:
- Automate downstream transformations (e.g., dbt Cloud, Airflow)
- Monitor and alert on data quality or pipeline health (e.g., Prometheus, Datadog)
With a solid understanding of these components, you're ready to start building. In the next section, we’ll help you define your use case and decide what metrics to surface in your real-time dashboard.
How to Build a Real-Time Dashboard (Step-by-Step)
Now that we’ve covered the foundational components, let’s walk through the exact steps to build a real-time dashboard — from selecting your use case to visualizing your data. Whether you're building a real-time analytics dashboard for product metrics, operational monitoring, or business KPIs, this guide will help you do it the right way.
Step 1: Identify the Use Case and Real-Time Metrics
Every great dashboard starts with a clear purpose. Before writing a single line of code or spinning up infrastructure, it’s essential to define what you’re measuring and why. This step helps you stay focused on delivering business value, not just streaming data for its own sake.
Start with a Specific Use Case
Ask yourself: What decision needs to be made faster with real-time information?
Examples of high-impact use cases include:
- E-commerce: Track product sales, cart abandonment, and campaign performance in real-time
- Logistics and supply chain: Monitor fleet locations, delivery times, and warehouse inventory
- SaaS product analytics: Visualize live user sessions, feature usage, and error rates
- Marketing operations: View campaign metrics like click-through rate (CTR), impressions, and spend as they happen
Define the Key Metrics
Once you know the use case, break it down into measurable KPIs (Key Performance Indicators) and events:
- What data do you need to track those KPIs?
- At what frequency should this data update?
- How will users interpret the data and take action?
Here are some example real-time metrics:
- Number of user logins in the past 5 minutes
- Orders placed per minute
- Average latency of API requests
- Failed transaction count over a 15-minute window
Real-time dashboards work best when the metrics are actionable, time-sensitive, and continuously changing.
Pro Tip: Think Granularity
Decide how granular your dashboard needs to be:
- Is second-by-second data too noisy?
- Would minute-level or 5-minute windows be more insightful?
Choosing the right granularity prevents dashboard fatigue and improves clarity for decision-makers.
With your use case and KPIs clearly defined, the next step is to connect to the systems where this data originates and set up a real-time data pipeline that keeps everything fresh.
Step 2: Connect to Real-Time Data Sources
Once you’ve defined your use case and metrics, it’s time to connect to the systems where your data originates. This is the foundation of your real-time data pipeline — and it starts with selecting the right streaming data sources.
To power a real-time dashboard, you must ingest data the moment it changes. That’s where Change Data Capture (CDC), event streams, and webhook-based sources come in.
Use Estuary to Capture Data in Real Time
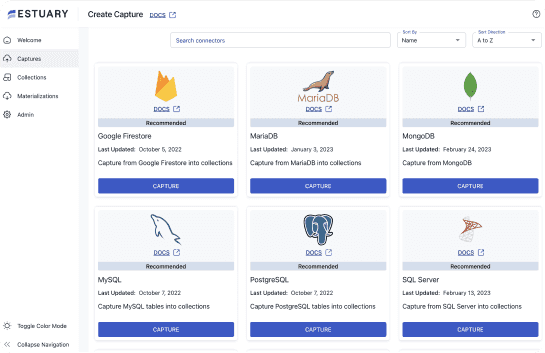
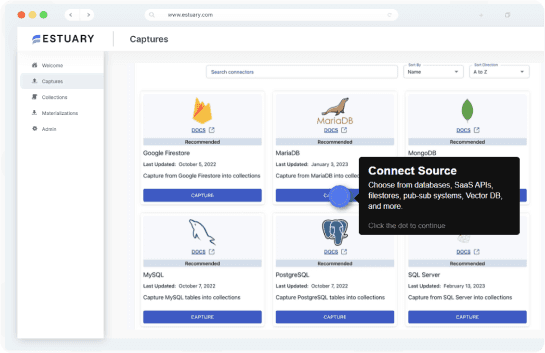
Estuary gives you instant access to a wide range of real-time data sources — no custom engineering required. It has a rich set of out-of-the-box connectors that support everything from CDC-enabled databases to event streams and SaaS platforms. Choose one or more capture connectors to get started.
If you're working with relational databases like PostgreSQL, MySQL, SQL Server, or MongoDB, Estuary uses Change Data Capture (CDC) to tap directly into their transaction logs. This means every insert, update, and delete is captured in real time and published as a structured JSON document to the corresponding data collection in Estuary, ready for downstream processing.
For cloud applications, Estuary integrates with popular SaaS APIs including Shopify, HubSpot, Stripe, Salesforce, and Zendesk. These connectors rely on webhooks or efficient polling mechanisms to ingest new data as soon as it appears, so your dashboard never lags behind what's happening in the business.
And if you're already running an event-driven architecture, Estuary has you covered there too. You can stream data directly from Apache Kafka, set up custom webhook endpoints, or ingest from IoT devices and log emitters. Estuary treats each event like a first-class citizen — applying schema validation and metadata enrichment to ensure clean, queryable data.
What makes this even more powerful is that you don’t need to manage the infrastructure. Estuary handles scalability, durability, and delivery guarantees — letting your team focus on building insights, not pipelines.
Step 3: Transform and Model the Data (Optional but Recommended)
With raw data now flowing into your pipeline, the next step is to prepare it for your dashboard, and that usually means transforming and modeling it.
While you can build a real-time dashboard without this step by passing raw data straight to your destination, most real-world use cases benefit from some level of data transformation.
Why Transform Your Streaming Data?
Here are a few reasons why transformation is a best practice:
- Normalize inconsistent fields across multiple sources (e.g., unify time formats or status codes)
- Aggregate high-velocity data into time windows (e.g., orders per minute, error counts per hour)
- Apply business logic, such as segmenting customers or calculating derived metrics
- Clean error-producing inputs like nulls, duplicates, or out-of-range values
- Flatten nested JSON for easier querying in BI tools
Dashboards are only as good as the data they show. If your users have to interpret raw payloads or run calculations manually, they’ll struggle to get real value.
Transform Data in Real Time with Estuary
Estuary makes real-time transformation simple using TypeScript- or SQL-based derivations. You can write familiar SQL queries to:
- Join across collections, even ones on different sync schedules
- Filter and reshape documents
- Generate new metrics or rollups
These derivations run continuously as new data arrives, effectively turning your pipeline into a real-time stream processor. And because Estuary handles the orchestration behind the scenes, there’s no need to manage a separate Spark or Flink cluster.
To get started, develop derivations locally using flowctl.
Alternatively, you can trigger dbt Cloud jobs once materializations are updated. This hybrid approach works well when you want real-time data landing in your warehouse, followed by scheduled dbt transformations.
Estuary also offers automatic schema evolution to help you adapt as your upstream sources change over time, without breaking your pipeline.
Step 4: Materialize the Data to a Dashboard-Compatible Destination
With your real-time data sources connected and (optionally) transformed, it’s time to materialize the data — that is, deliver it in real time to the system that your dashboard will read from.
This is a critical step. Your visualization tool (Metabase, Superset, Grafana, Looker, etc.) doesn’t connect to Kafka topics or JSON event streams directly. It needs data in a structured, queryable format — often in a database or data warehouse.
What Is Materialization?
Materialization is the process of persisting streaming data into a storage layer that can support querying and visualization. With Estuary, this happens in real time: as events arrive, they are written into your destination system within seconds.
Materialize to the Right Destination for Your Dashboard
Choose a destination that aligns with the BI tool you're using and the type of queries you plan to run:
| Destination Type | Best for | Examples |
| Data Warehouses | Scalable analysis, historical insights | BigQuery, Snowflake, Redshift |
| Relational Databases | Lightweight dashboards, embedded analytics | Metabase, Redash, Superset |
| Streaming Platforms | Time-series data, operational metrics | Grafana, Prometheus, Datadog |
| OLAP/Real-Time Analytics Databases | Low-latency analytics, high cardinality data | ClickHouse, Tinybird, Materialize |
Estuary supports materializations in all of the above categories.
You can configure materializations directly in the Estuary dashboard or via the flowctl CLI. Once set up, Estuary ensures that every insert, update, and delete in your pipeline is streamed to the destination reliably and in order.
🛡️ Estuary guarantees exactly-once or at-least-once delivery semantics, depending on the connector, making it suitable for even mission-critical reporting.
Step 5: Build the Dashboard UI
Now that your real-time data is materialized in a queryable format, it’s time to build the user interface — the actual dashboard your team will use to monitor and explore metrics.
This is where raw streams become insights, and your pipeline becomes truly valuable.
Choose a Real-Time Dashboard Tool
Pick a BI or visualization tool that suits your team and destination system:
- Metabase – Fast setup, no-code dashboards, ideal for PostgreSQL, MySQL, ClickHouse
- Apache Superset – SQL-first open-source platform for data warehouses like BigQuery or Snowflake
- Grafana – Real-time monitoring for time-series data from Kafka, Prometheus, or PostgreSQL
- Looker / Power BI / Tableau – Enterprise-ready tools for advanced modeling and governance
All of these tools can visualize streaming data if backed by a properly materialized source.
Connect to Your Data Destination
Once your BI tool is selected:
- Connect it to your materialized data destination (from Step 4)
- Define your data source in the BI tool’s settings
- Confirm that records are updating in real time — you can test this by triggering changes in the source system and watching them appear in your dashboard
Since Estuary streams data continuously, your visuals will update as soon as new records land in the destination — no batch syncing or manual refresh needed.
Build and Design Your Dashboard
- Start by selecting the KPIs and metrics you defined in Step 1
- Choose appropriate visualizations:
- Line charts for trends
- Bar charts for comparisons
- Gauges for threshold alerts
- Tables for detailed logs or transactions
- Group visuals into logical sections (e.g., user activity, sales metrics, system health)
- Add filters, dropdowns, and time range selectors to enhance interactivity
Dashboard Design Tips
- Prioritize clarity and readability — avoid clutter
- Use eye-catching colors and alerts sparingly to highlight anomalies
- Limit the number of queries on a single dashboard to improve performance
- Show time-relative metrics (e.g., “orders in the last 15 minutes”) to emphasize real-time behavior
Step 6: Test and Monitor the Pipeline
A real-time dashboard is only as good as the pipeline behind it. Once your system is live, it’s critical to monitor its performance, validate data accuracy, and ensure low latency from source to screen.
Test End-to-End Data Flow
Before going live:
- Simulate real-world changes in your source system (e.g., insert new records, update rows)
- Check if updates are captured by Estuary and materialized correctly
- Confirm that your dashboard reflects the changes in near real-time
Estuary lets you preview data at every stage — capture, transform, and materialize — so you can debug issues without guesswork.
Monitor Pipeline Health and Latency
Real-time pipelines are long-running systems, so it’s essential to track:
- Capture status: Is your source connector active and reading changes?
- Materialization lag: How quickly are updates reaching the destination?
- Throughput: Are you processing data fast enough to keep up with volume?
- Error rates and retries: Are transformations or schema mismatches causing drops?
Estuary provides an intuitive UI and metrics endpoints for observation. You can integrate Estuary’s OpenMetrics API with systems like Prometheus or Datadog for deeper monitoring.
Backfills and Consistency Checks
If you're adding Estuary to an existing system, you may need to:
- Run a backfill to load historical data before live updates begin
- Rebuild materializations if schemas evolve
- Use Estuary’s time travel filters to replay or limit data for validation
In production, always test pipeline changes in staging environments first to prevent downstream issues in your dashboard.
With observability and alerts in place, your real-time dashboard becomes a dependable part of your operational toolkit, not just a flashy frontend.
Next up: a few bonus features to take your dashboard to the next level.
Bonus: Add Time Travel and Real-Time Alerts
Once your real-time dashboard is up and running, there are two powerful enhancements you can layer on to get even more value: historical snapshots and alerting.
Time Travel for Historical Insights
Sometimes you don’t just want to know what’s happening now — you also want to understand what happened then.
With Estuary’s built-in time travel capability, you can materialize data based on specific windows using notBefore and notAfter filters. This lets you:
- Recreate historical snapshots of your data
- Compare metrics across time periods (e.g., this week vs. last week)
- Run consistency checks by rematerializing a known timeframe
This feature is especially useful when you need auditability or want to perform periodic lookbacks alongside real-time analytics.
Real-Time Alerting for Proactive Monitoring
A real-time dashboard is great for visibility, but sometimes you need to be notified the moment something unusual happens.
You can set up alerts and threshold-based notifications in your BI or monitoring tools:
- Grafana supports real-time alerts using queries over materialized data
- Superset and Metabase allow scheduled alerts for specific conditions
- Prometheus can monitor Estuary’s pipeline metrics and fire alerts via PagerDuty, Slack, or email
Common alerting use cases:
- Spike in error rates or dropped events
- Drop in API traffic or conversions
- Surge in order volume or user signups
Combine Estuary with your monitoring stack to catch data pipeline issues before your users do.
Conclusion: Start Building Your Real-Time Dashboard Today
Real-time dashboards are no longer just for tech giants or engineering-heavy teams. With the right architecture — and the right tools — any team can build a streaming analytics interface that delivers insights in seconds, not hours.
Here’s a quick recap of how to build a real-time dashboard:
- Define your use case and identify key metrics
- Capture streaming data from sources using Estuary
- Transform and model data as needed for clarity and performance
- Materialize it to a destination that your BI tool can query
- Build your dashboard UI with tools like Metabase, Superset, or Grafana
- Monitor pipeline health and latency to ensure trust in your data
- Add time travel and alerting for next-level observability
By using Estuary, you can skip the complexity of stitching together brittle ETL tools and instead rely on a robust, fully managed real-time data streaming platform that’s designed for scale, flexibility, and speed.
Whether you're building your first dashboard or scaling mission-critical analytics, Estuary helps you get there faster and more reliably.
Ready to build?

About the author
Emily is a software engineer and technical content creator with an interest in developer education. She has experience across Developer Relations roles from her FinTech background and is always learning something new.

