Introduction
Datadog is one of the most widely used platforms for monitoring, logging, and application performance management. While Datadog dashboards are powerful for observability, engineering and analytics teams often need to combine Datadog data with operational or business data stored in PostgreSQL. For example, you might want to:
- Correlate application error logs with customer account data.
- Join real user monitoring (RUM) metrics with product usage tables.
- Store monitor alerts in Postgres for downstream analysis or auditing.
Traditionally, getting Datadog data into Postgres requires custom scripts, brittle ETL jobs, or manual exports. These methods are slow, error-prone, and difficult to keep in sync with continuous monitoring data.
This is where Estuary helps. Estuary provides ready-to-use connectors that can continuously capture data from Datadog and materialize it into PostgreSQL. You can do this in real time, with exactly-once delivery guarantees, and without writing or maintaining custom pipelines.
In this guide, we’ll walk through two supported approaches to integrate Datadog with Postgres using Estuary:
- Method A: Capture logs and real user monitoring data from the Datadog API and sync them into Postgres.
- Method B: Capture metric alerts and incident events through Datadog webhooks and push them into Postgres.
By the end, you’ll have a reliable, production-ready pipeline that continuously brings Datadog data into PostgreSQL for deeper analytics and reporting.
Key Takeaways
Integrate Datadog with PostgreSQL in real time using two methods: API Capture (logs, RUM) or Webhook Capture (alerts).
Estuary guarantees exactly-once delivery and avoids brittle ETL scripts.
API Capture = best for structured, historical logs and Real User Monitoring (RUM).
Webhook Capture = best for instant alerts and push-based events.
Data can be reshaped with SQL/TypeScript before landing in Postgres.
Secure with bearer tokens, TLS, and least-privilege database credentials.
Use cases: error log correlation, RUM + product usage, incident alerts.
Prerequisites
Before setting up your Datadog to Postgres pipeline in Estuary, make sure you have the following in place:
1. Estuary account
- Sign up or log in at Estuary.
2. PostgreSQL database
- A running PostgreSQL instance (self-hosted, cloud-hosted, or managed service such as RDS, Cloud SQL, or Neon).
- Ensure it’s reachable from Estuary:
- Either allowlist Estuary’s IP addresses in your Postgres firewall settings.
- Or configure a secure SSH tunnel between Estuary and your database.
- Have the following ready:
- Host and port (host:port)
- Username and password
- Database name (optional)
- Schema name (optional; defaults to public)
3. Datadog credentials
Depending on which method you choose:
- For Method A (API capture)
- A Datadog API key.
- A Datadog Application key with the correct scopes:
- rum_apps_read for RUM data.
- logs_read_data for log events.
- Your Datadog site, for example:
- datadoghq.com (US1)
- us3.datadoghq.com, us5.datadoghq.com
- datadoghq.eu (EU1)
- ddog-gov.com (Gov)
- For Method B (Webhook capture)
- Access to Datadog’s Webhooks integration.
- Ability to create a webhook with a target URL provided by Estuary.
- Optionally, configure the webhook payload using Datadog’s built-in variables (like $ALERT_ID, $ALERT_TITLE, $ALERT_STATUS).
Method A: Datadog API Capture to Postgres
This method is best when you want to pull structured data from Datadog’s APIs—for example, Logs or Real User Monitoring (RUM) events—into PostgreSQL for deeper analytics.
Step 1. Create a Datadog Capture in Estuary
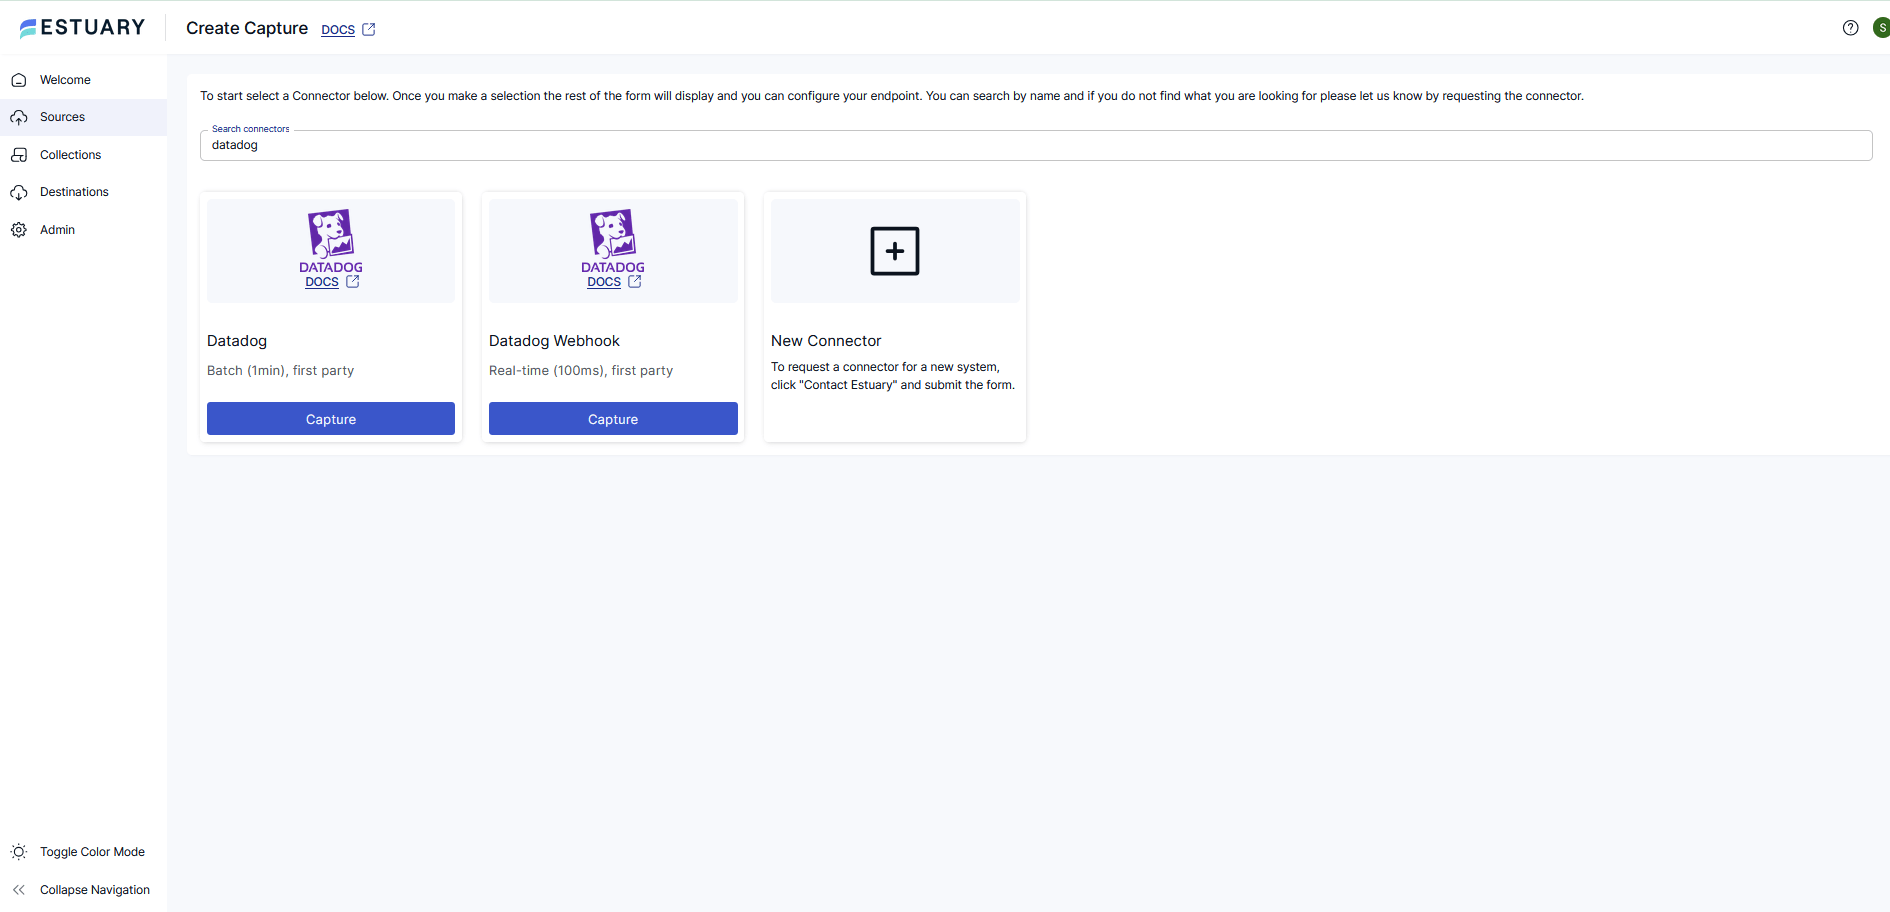
- In the Estuary dashboard, click Captures → New Capture.
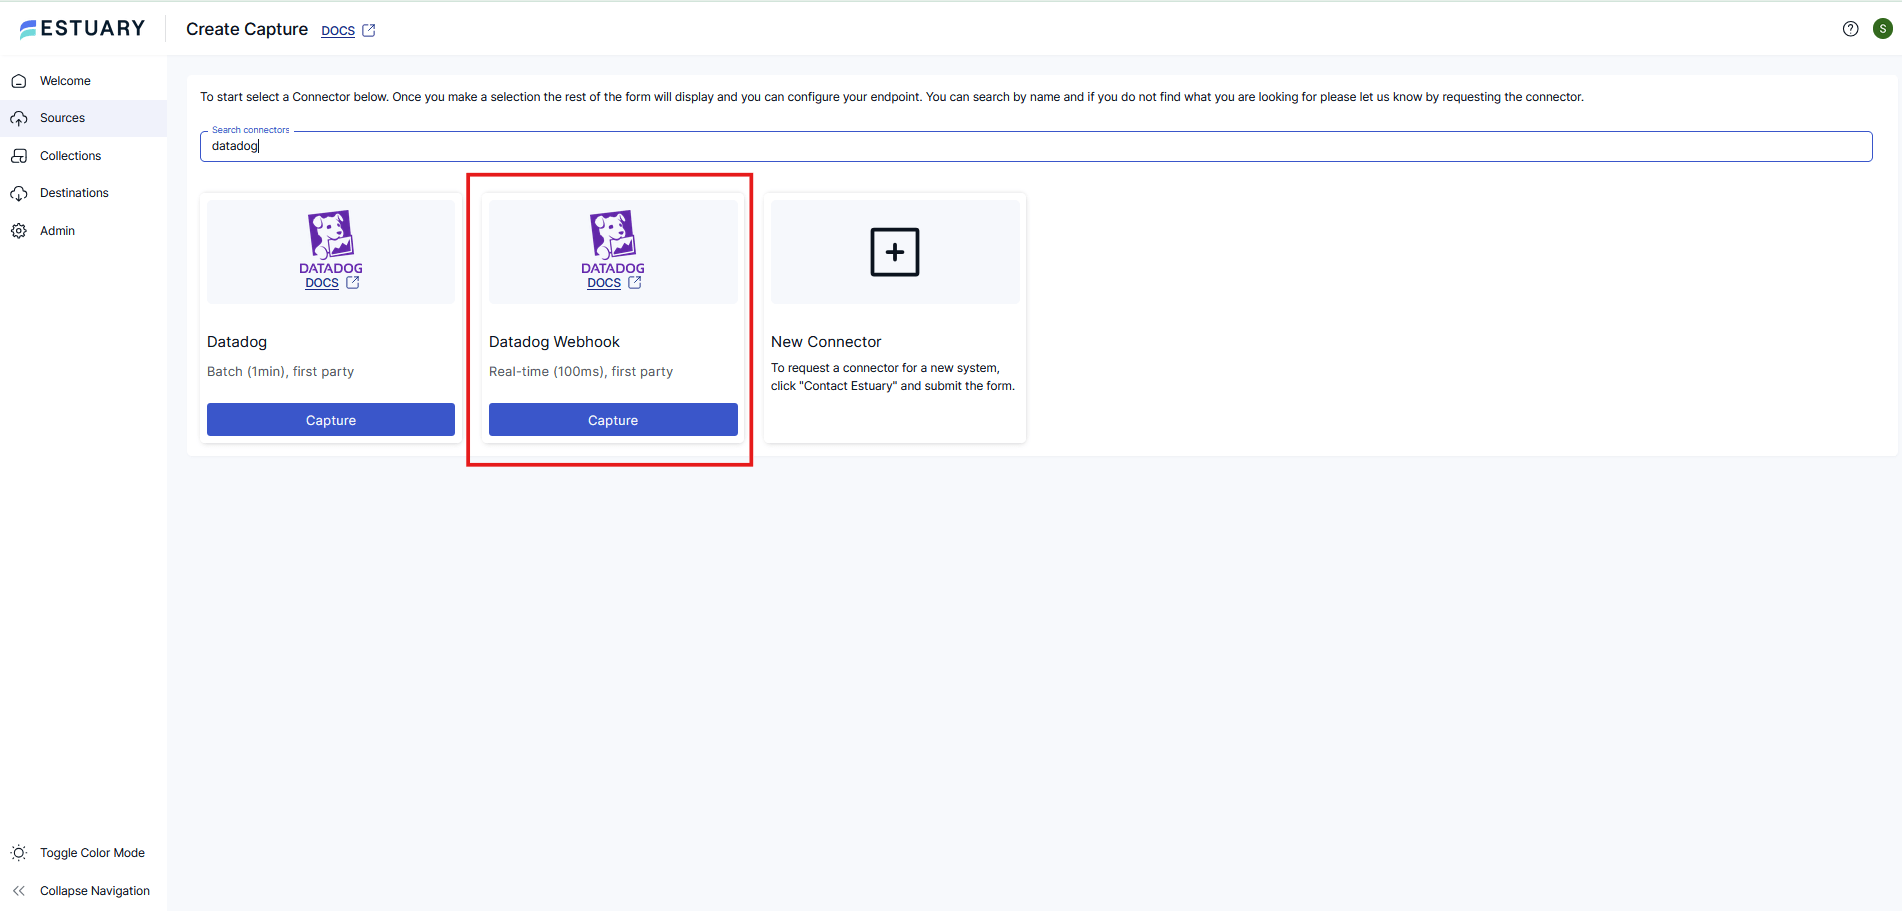
- Select the Datadog connector.
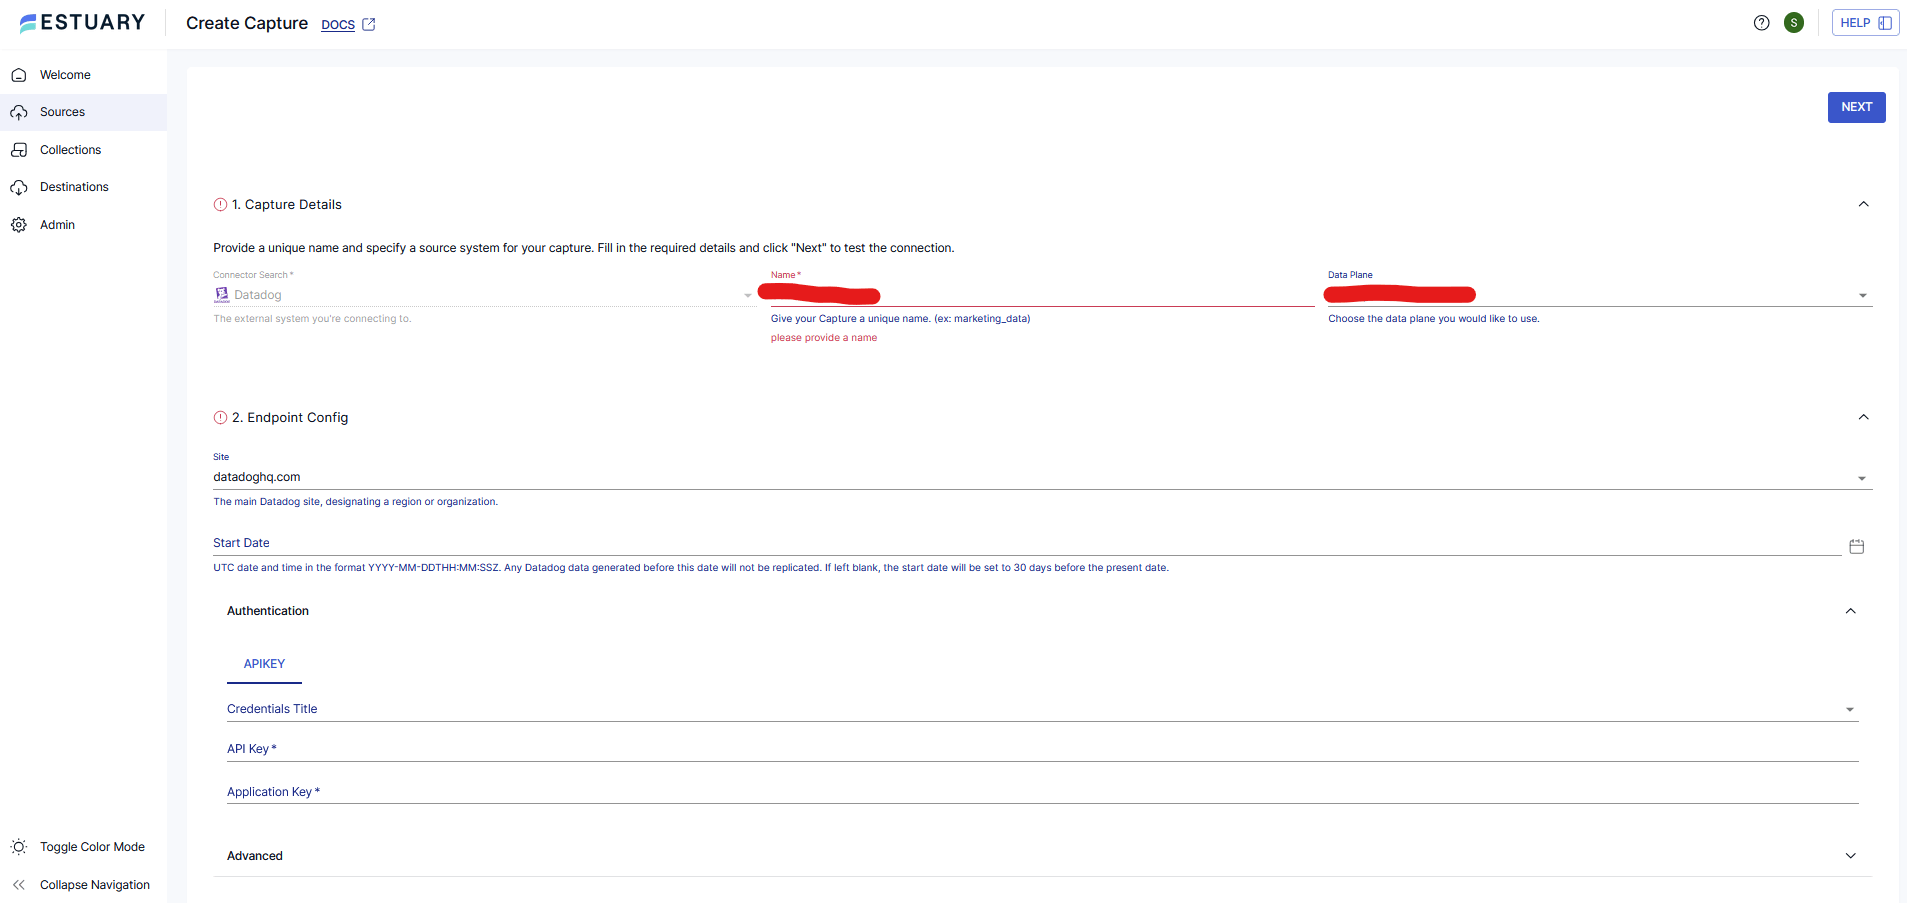
- Fill in the configuration:
- Site: Choose your Datadog region (e.g., us5.datadoghq.com).
- API Key: Paste your Datadog API key.
- Application Key: Paste your Datadog app key with the required scopes (logs_read_data and rum_apps_read).
- Start Date (optional): Provide an ISO timestamp if you want to backfill from a specific point. If not provided, Datadog’s default retention window applies (e.g., 30 days for RUM).
- Select bindings for the resources you want:
- logs
- real_user_monitoring
- Click Save & Publish. Estuary will now create collections that continuously ingest data from Datadog.
YAML Example:
plaintextcaptures:
  acme/datadog:
    endpoint:
      connector:
        image: ghcr.io/estuary/source-datadog:dev
        config:
          credentials:
            credentials_title: Private App Credentials
            access_token: ${DATADOG_API_KEY}
            application_key: ${DATADOG_APP_KEY}
          site: us5.datadoghq.com
          start_date: "2025-01-01T00:00:00Z"   # optional backfill
    bindings:
      - resource: { name: logs }
        target: acme/datadog/logs
      - resource: { name: real_user_monitoring }
        target: acme/datadog/rum
Step 2. Verify Collections and Keys
Once the capture is running:
- Navigate to the Collections tab in Estuary.
- Inspect documents in target collections, such as acme/datadog/logs or acme/datadog/rum.
- Each collection will have a default schema and keys, but you can adjust them if you want to deduplicate on event IDs or partition by other fields.
Step 3. (Optional) Reshape Data with a Derivation
Datadog logs and RUM payloads are nested JSON objects. If you want a flatter relational schema before landing in Postgres:
- Create a derivation in Estuary.
- Use SQL or TypeScript transforms to select and rename fields.
Example: Flatten a log object with TypeScript
typescriptexport class Derivation extends IDerivation {
  publish(log: any) {
    const a = log.attributes || {};
    return {
      id: log.id ?? a?.event?.id,
      timestamp: a.timestamp ?? log.timestamp,
      service: a.service,
      host: a.host,
      status: a.status,
      message: a.message
    };
  }
}
Step 4. Materialize Collections to PostgreSQL
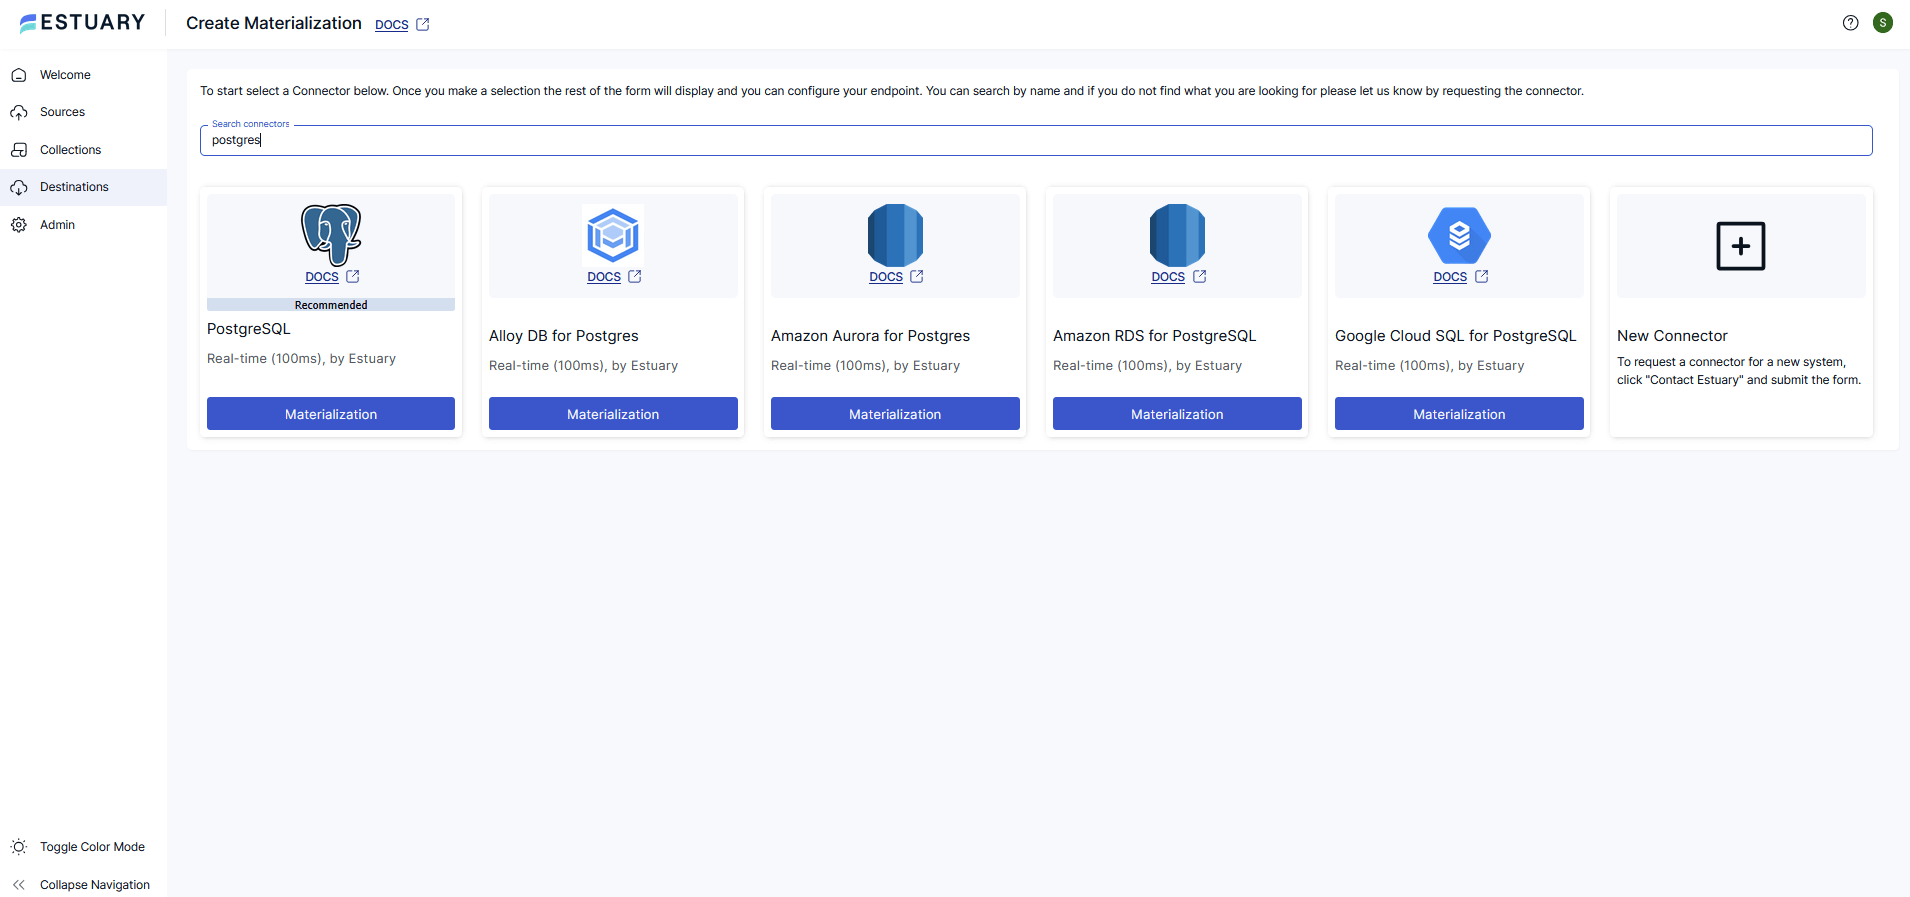
- Go to Destination → New Materialization.
- Select PostgreSQL as the destination.
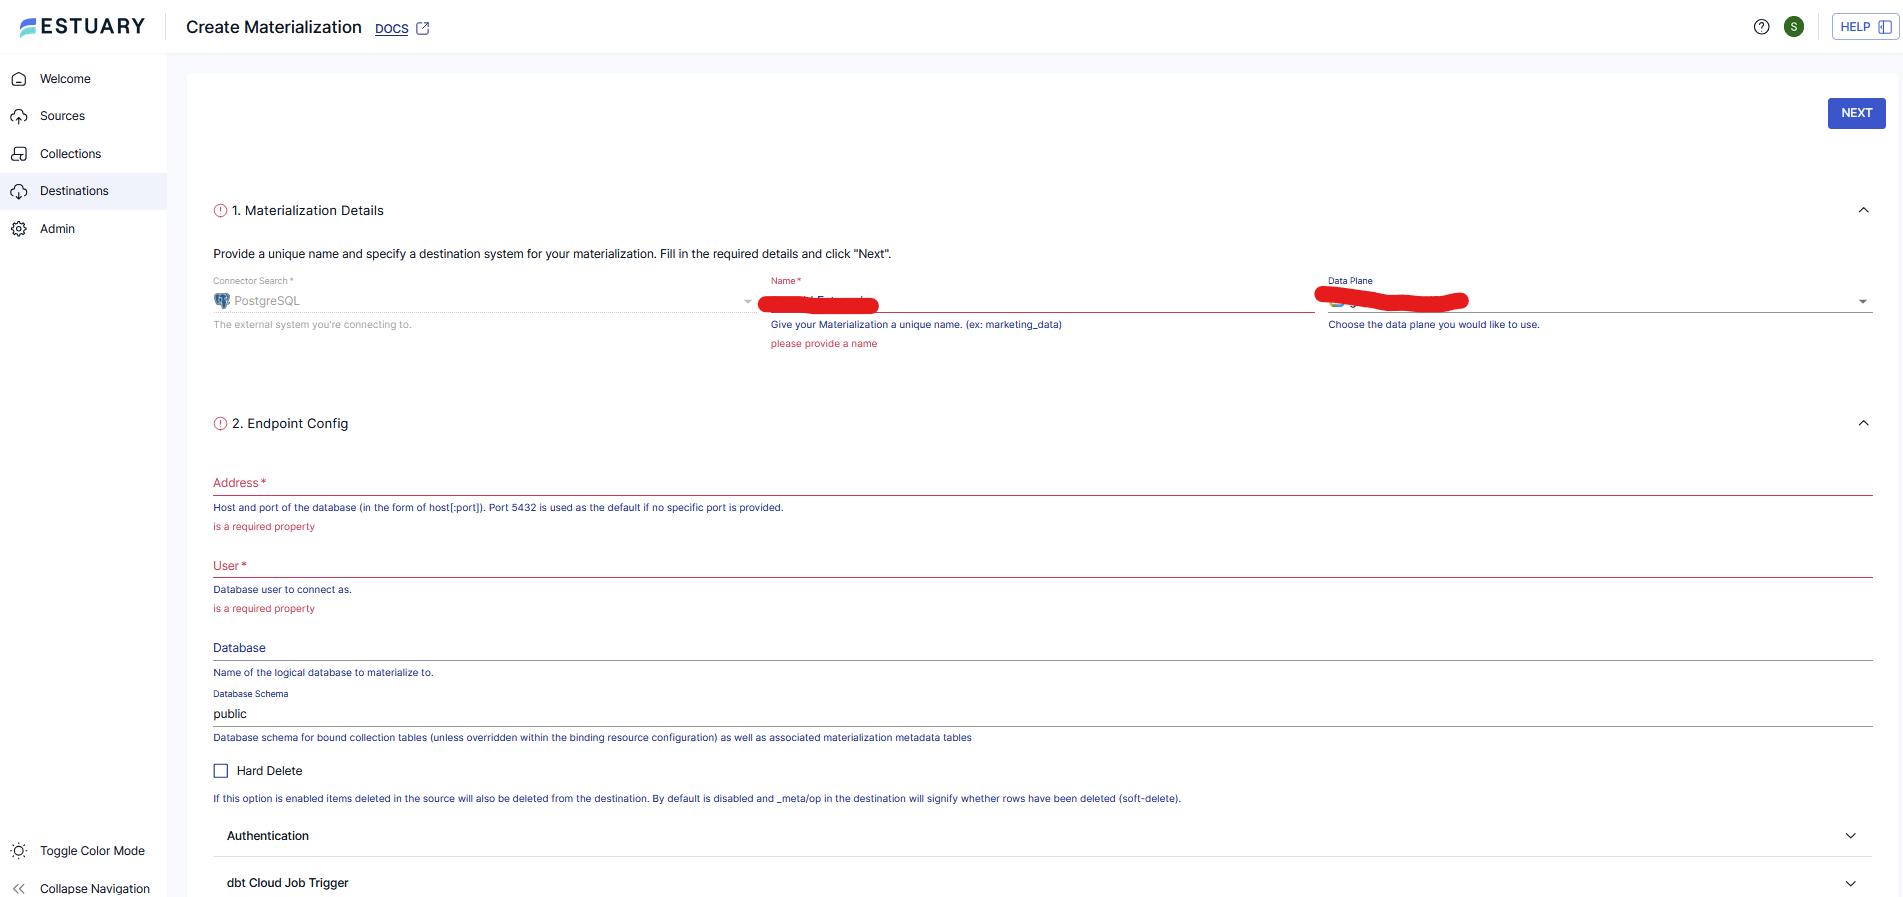
- Fill in your database details:
- address (host:port)
- database
- user
- password
- schema (optional, defaults to public)
- Add bindings from the Datadog collections you captured (logs, rum).
- Click Save & Publish. Estuary will create the target tables automatically and begin applying changes continuously.
YAML Example:
plaintextmaterializations:
  acme/postgres:
    endpoint:
      connector:
        image: ghcr.io/estuary/materialize-postgres:dev
        config:
          address: ${PG_HOST}:5432
          database: ${PG_DB}
          user: ${PG_USER}
          password: ${PG_PASSWORD}
          schema: public
    bindings:
      - source: acme/datadog/logs
        resource: { table: datadog_logs }
      - source: acme/datadog/rum
        resource: { table: datadog_rum }
Step 5. Validate in PostgreSQL
Query your Postgres instance to confirm data is streaming in near real time:
plaintext-- Example: Get the latest error logs
SELECT id, timestamp, service, host, status, message
FROM public.datadog_logs
WHERE status = 'error'
ORDER BY timestamp DESC
LIMIT 100;
You now have Datadog logs and RUM data continuously syncing into Postgres for analytics, joins, and downstream applications.
Have questions while setting up? Join our Estuary Slack community and get help directly from experts.
Method B: Datadog Webhook Capture to Postgres
Use this method when you want immediate push delivery of monitor alerts or events from Datadog into PostgreSQL. Datadog sends a JSON payload to Estuary’s HTTP Ingest endpoint. Estuary turns each request into a document in a collection, which you then materialize to Postgres.
Step 1. Create an HTTP Ingest capture in Estuary
- In the Estuary dashboard, go to Sources → New Capture.
- Choose Datadog Webhook.
- Configure the endpoint:
- paths: one or more URL paths Estuary should accept. Example ["/datadog/alerts"].
- require_auth_token: set a strong token. Datadog will send it as a Bearer token.
- By default, a new binding will be created for each URL path in the connector. You can optionally configure bindings further:
- Id From Header: Set the /_meta/webhookId from the given HTTP header in each request. If not set, then a random id will be generated automatically.
- Path: The URL path to use for adding documents to this binding. Defaults to the name of the collection.
- Stream: The name of the binding, which is used as a merge key when doing Discovers.
- Save and publish. Estuary will show the public endpoint that will form the base path for each binding-level path.
YAML example
plaintextcaptures:
  acme/datadog-webhook:
    endpoint:
      connector:
        image: ghcr.io/estuary/source-http-ingest:dev
        config:
          require_auth_token: ${WEBHOOK_TOKEN}
          paths: ["/datadog/alerts"]
    bindings:
      - resource: { stream: datadog_alerts, path: "/datadog/alerts" }
        target: acme/datadog/alerts
Notes
- The connector accepts the Authorization: Bearer <token> header and rejects requests without the correct token.
- Path parameters are available under /_meta/pathParams/* and query parameters under /_meta/query/* in each document.
- Signature verification is not enabled for this connector. Use bearer auth and network controls.
Step 2. Create a Datadog Webhook and wire it to monitors
- In the Datadog app, open the Webhooks integration. Create a new webhook.
- URL: Your Estuary URL from Step 1, for example https://<your-endpoint>/datadog/alerts.
- Name: Provide a name for your Datadog webhook
- Authentication settings: Choose Request Header as the authentication type and add an Authorization header with your chosen token as a value.
- In your monitor notifications, define when your webhook will activate:
- Create a new Metric type monitor.
- Define alert conditions.
- Under Notify your team, choose your webhook (@your-webhook)
- Datadog will retry on 5xx responses with a 15 second timeout. Make sure your endpoint responds quickly with a 2xx status.
Example Datadog webhook JSON payload
plaintext{
  "alert_id": "$ALERT_ID",
  "title": "$ALERT_TITLE",
  "type": "$ALERT_TYPE",
  "status": "$ALERT_STATUS",
  "date": "$DATE",
  "hostname": "$HOSTNAME",
  "tags": "$TAGS",
  "event_id": "$ID"
}
Step 3. Set a reliable key for de-duplication
Open the collection acme/datadog/alerts in Estuary and set its key based on a unique field in your payload. Good options:
- ["/event_id"] if you included $ID as event_id
- ["/alert_id", "/date"] as a composite if a single unique field is not available
If you used idFromHeader in the capture config, Estuary will use that header’s value to deduplicate. Otherwise, the key you set on the collection governs deduplication behavior.
Step 4. (Optional) Reshape the payload
If you prefer flatter tables in Postgres, create a derivation that selects and renames fields. You can use SQL or TypeScript to produce a tidy schema with the fields you plan to query.
Step 5. Materialize alerts to PostgreSQL
- Go to Destinations → New Materialization.
- Select PostgreSQL.
- Enter:
- address as host:port
- database, user, password
- optional schema such as public
- Add a binding from the alerts collection to a table name such as datadog_alerts.
- Save and publish. The connector creates the table and begins continuous updates.
YAML example
plaintextmaterializations:
  acme/postgres-alerts:
    endpoint:
      connector:
        image: ghcr.io/estuary/materialize-postgres:dev
        config:
          address: ${PG_HOST}:5432
          database: ${PG_DB}
          user: ${PG_USER}
          password: ${PG_PASSWORD}
          schema: public
    bindings:
      - source: acme/datadog/alerts
        resource: { table: datadog_alerts }
Step 6. Validate end-to-end
Trigger a test notification in Datadog or force a monitor to alert. Then query Postgres.
plaintextSELECT title, status, date, hostname, tags
FROM public.datadog_alerts
ORDER BY date DESC
LIMIT 50;
If rows appear and update as alerts resolve or trigger again, your webhook pipeline is working.
Security checklist
- Require a strong bearer token in the HTTP Ingest capture.
- Restrict who can access the URL. If your environment requires private networking, consider placing Estuary in a private deployment or securing egress with an allowlist.
- In Postgres, use least-privilege credentials and sslmode that matches your provider’s policy.
Need a custom deployment or have security/compliance requirements? Contact us and we’ll walk you through your options.
Estuary also lets you move Datadog data into a wide range of destinations, including Snowflake, BigQuery, Redshift, Databricks, MySQL, SQL Server, Kafka, and Elasticsearch, among others.
Conclusion
Bringing Datadog data into PostgreSQL opens up a new layer of analysis by combining observability insights with operational and business datasets. Whether you want to analyze error logs alongside customer records, join RUM metrics with product usage, or track monitor alerts in a central database, Estuary makes it possible in just a few steps.
- Method A is ideal when you need structured, historical context such as Logs or RUM data.
- Method B is perfect for near-instant alert notifications and monitor events.
With Estuary, both approaches give you a reliable, real-time pipeline with exactly-once delivery to Postgres, without the complexity of custom scripts or fragile ETL jobs.
If you’re ready to get started, sign up for Estuary and set up your first Datadog to Postgres pipeline today. You’ll have production-ready data syncs running in minutes, not weeks.
See how teams like yours are streaming data in real time with Estuary >> Success Stories

About the author
Team Estuary is a group of engineers, product experts, and data strategists building the future of real-time and batch data integration. We write to share technical insights, industry trends, and practical guides.

