Modern data systems have become increasingly complex. Data no longer flows through a single monolithic application; it travels across distributed, loosely coupled services: streaming platforms, cloud data warehouses, ETL jobs, orchestrators, dashboards, and machine learning pipelines. This complexity has made it more challenging to understand whether the system is running and whether the data is correct, fresh, and trustworthy.
This is where data observability comes into play. As a discipline focused on understanding the health, accuracy, and behavior of data pipelines, data observability helps teams maintain trust in their data across every stage of the stack.
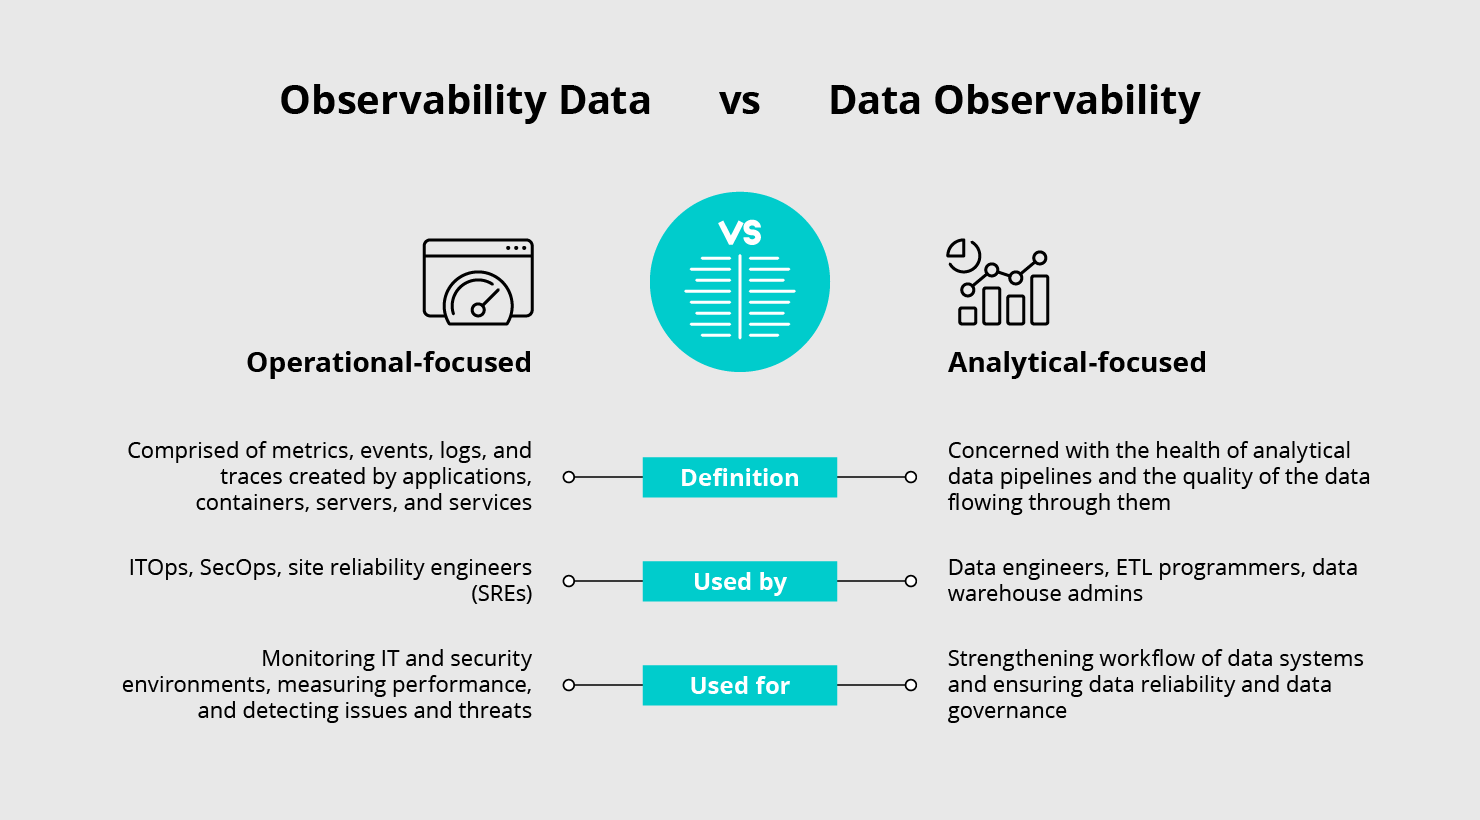
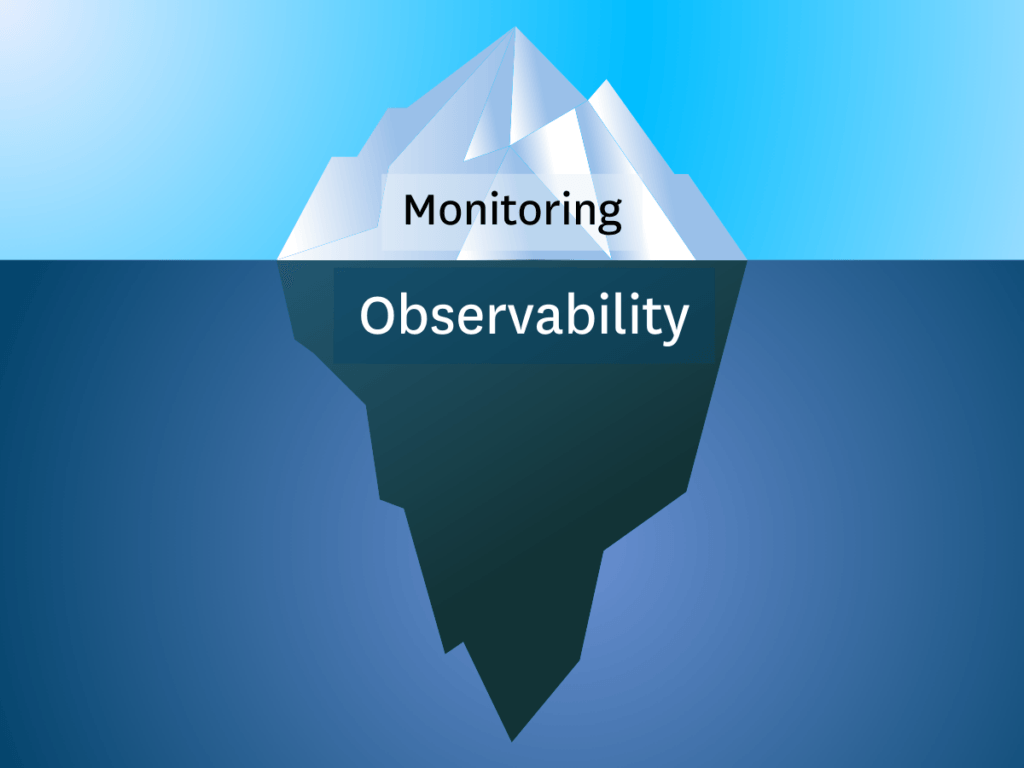
From System Observability to Data Observability
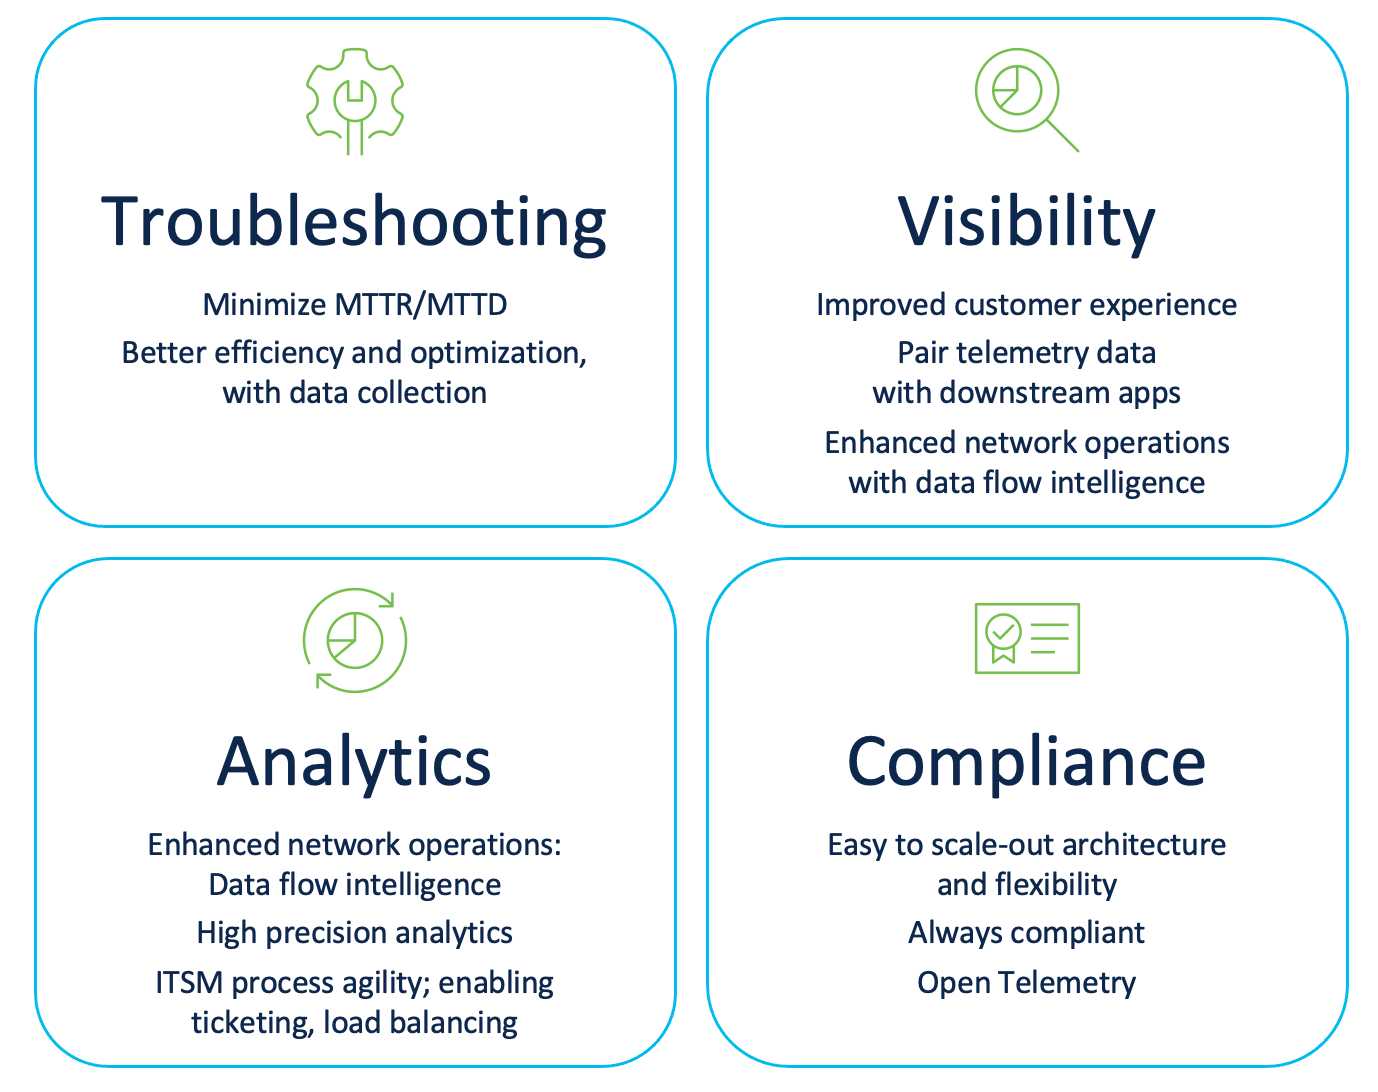
Source: https://cribl.io/blog/observability-data-vs-data-observability-whats-the-difference/
System observability answers questions like:
- Is the API responding within SLA?
- Did the server experience an out-of-memory error?
This type of observability is invaluable for maintaining system uptime and performance. But as modern organizations scale their data pipelines, a new layer of visibility is required, one that focuses not just on systems but on the data itself.
In contrast, data observability answers questions like:
- Why is the dashboard showing zero revenue today?
- Was the data in this report delayed, corrupted, or dropped?
This shift is essential because data is not just a by-product anymore; it's an operational asset. Teams across business intelligence (BI), analytics, and machine learning depend on it to make critical decisions. Your decisions will be too if your data is stale, incomplete, or incorrect.
The Stakes: Trust in Data
When data pipelines break, stall, or silently fail, the result is data downtime: periods when data is wrong, missing, or not updated. The downstream impact can be severe:
- Executives make decisions based on bad dashboards.
- Data scientists train models on corrupted inputs.
- Analysts waste hours debugging reports.
- Teams lose trust in data, slowing down adoption.
In the worst case, insufficient data can lead to regulatory violations or loss of customer trust.
Data observability aims to prevent this. It ensures that:
- You are the first to know when data is broken.
- You can quickly trace the root cause.
- You can resolve issues before they affect users or customers.
In this article, we’ll explore what data observability means, why it’s hard, and how modern tools (both open-source and commercial) are evolving to meet this challenge.
Next, we’ll define data observability in detail and break down its key pillars.
What Is Data Observability in the Modern Data Stack?
Data observability is the ability to monitor, measure, and understand the health of data as it moves through pipelines, from ingestion to the end user. Just as traditional observability provides insight into system behavior through metrics, logs, and traces, data observability offers visibility into the state and behavior of data using structured signals such as metadata, lineage, quality metrics, and freshness indicators.
It extends across the entire data lifecycle, from raw ingestion to transformation, storage, and final consumption in BI tools or machine learning models. The goal is simple but powerful: to ensure that data is accurate, timely, complete, and traceable at all times.
5 Pillars of Data Observability for Reliable Pipelines
Source: https://www.montecarlodata.com/
To make sense of this space, the community has converged around five foundational pillars that define what must be monitored to ensure data reliability. Each pillar captures a different dimension of data health:
1. Freshness
Freshness measures how up-to-date the data is relative to expectations. For example, if a sales report is expected to reflect hourly updates, a delay of several hours might indicate a problem. Tracking freshness helps identify pipeline lags, ingestion stalls, and late-arriving data, which is critical for time-sensitive analytics and real-time operations.
2. Volume
Volume refers to the number of records flowing through a pipeline. An unexpected drop or spike can indicate upstream issues like a missing data partition, API failure, or duplicate ingestion. Volume metrics provide a first line of defense against silent data loss or bloating.
3. Schema
Schema observability tracks changes to the structure of datasets, like new or missing columns, data type changes, or reordered fields. Uncoordinated schema changes are a common cause of pipeline failures and downstream errors. Monitoring schema ensures compatibility and protects consumers who rely on a stable interface.
4. Data Quality
This pillar addresses the validity, completeness, and consistency of the data. Think null value spikes, unexpected value ranges, or duplicate records. Many issues fall into this category: logic bugs in transformation code, faulty joins, or corrupted source data. Data quality monitoring is essential for catching silent failures that don’t crash a job but still deliver bad results.
5. Lineage
Lineage tracks how data flows through the system, what upstream tables or services produced it, what transformations it underwent, and which downstream assets consume it. End-to-end lineage is vital for impact analysis (e.g., “If I change this table, who will be affected?”) and root cause analysis during incidents.
These pillars are not siloed; they interact and reinforce one another. For example, a sudden schema change may lead to data quality issues, which might delay a dashboard, violating freshness expectations. Observability means correlating and tracing these relationships in a structured way.
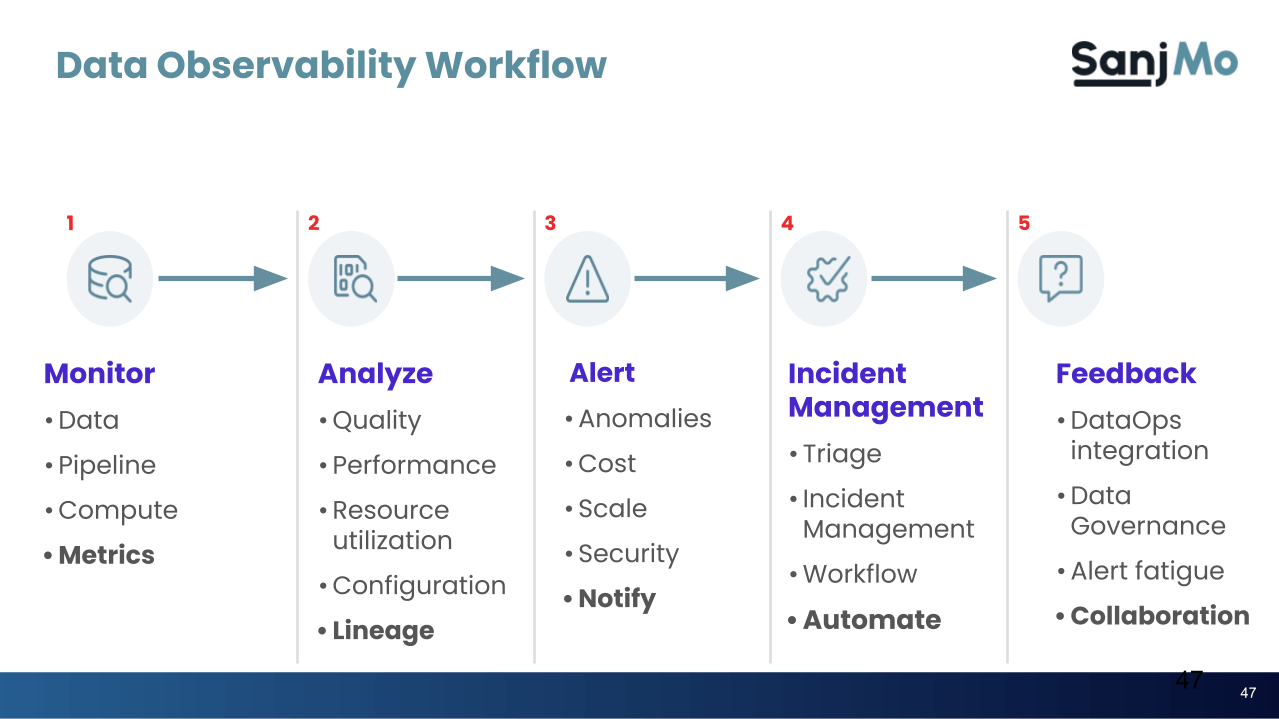
Scope of Data Observability
Source: https://sanjmo.medium.comThe scope of data observability is vast and growing. It spans every layer of the modern data stack, including:
- Ingestion systems (e.g., Kafka, Pub/Sub)
- ETL/ELT pipelines (e.g., dbt, Airflow, Spark)
- Data lakes and warehouses (e.g, Snowflake, BigQuery, Redshift)
- BI and reporting layers (e.g., Looker, Tableau)
- Machine learning pipelines (e.g, feature stores, model training datasets)
This observability isn’t limited to operational metrics; it includes metadata (schemas, ownership), behavioral signals (job execution logs), and semantic context (e.g., business-critical vs. auxiliary datasets).
Significantly, data observability intersects with other disciplines:
- Data governance: By tracking access, lineage, and data classifications, observability supports compliance and auditing.
- Security: Monitoring how data moves helps detect unauthorized access or leakage.
- ML observability: Ensures the integrity of training and inference data, which helps identify model drift or input anomalies.
Why Data Observability Matters for Modern Data Teams
In a mature data organization, pipelines are not fire-and-forget jobs. They are production-grade systems that power decision-making. Observability ensures they are measurable, debuggable, and predictable, which is essential for safely and efficiently scaling data usage.
In the next chapter, we’ll explore the concrete challenges that data observability solves, from pipeline failures to data quality incidents and troubleshooting across fragmented tools.
Key Challenges Solved by Data Observability
Data observability is not just a buzzword; it’s a response to real, persistent challenges that data teams face in production environments. As pipelines grow in complexity and scope, maintaining trust in data becomes harder. Silent failures, missed SLAs, and opaque dependencies can paralyze operations and degrade decision-making. This chapter breaks down the core problems that data observability helps to address.
Pipeline Failures and Data Downtime
One of the most frustrating and costly issues in data engineering is data downtime periods when data is delayed, incomplete, or flat-out wrong. Most often, the root cause is a pipeline failure somewhere upstream.
These failures often go undetected because jobs may not emit alerts, or the monitoring only checks whether the system ran, not if the data it produced is valid. Data consumers typically discover problems after the fact, when they notice stale dashboards or broken queries.
Without observability, there’s no easy way to:
- Know that a pipeline failed immediately.
- Understand what caused the failure.
- Assess the downstream impact.
Data observability helps reduce mean time to detection (MTTD) and resolution (MTTR) by providing structured signals, like failed job alerts, volume anomalies, and lineage-based impact analysis.
Latency and Delivery Delays
Even when pipelines don’t fail, they may run too slowly. SLA violations where data doesn’t arrive on time can cascade into downstream delays in reporting or model refreshes.
This problem is amplified in multi-stage pipelines with many dependencies:
- A slow upstream job delays all consumers.
- Bottlenecks are hard to trace across tools.
Without detailed telemetry and freshness tracking, latency issues are complex to detect early. Observability tools track when data was last updated, how long each stage takes, and where delays accumulate. This makes it possible to detect and diagnose lags before they breach SLAs.
Data Quality Issues (“Silent Failures”)
The most dangerous problems are the ones that go unnoticed. A pipeline can run successfully while outputting insufficient data, due to logic errors, upstream schema changes, or unexpected input values. These are known as silent failures.
Examples include:
- Null values in critical fields.
- Out-of-range metrics.
- Unexpected schema drift.
- Duplicates or missing records.
Since the job completes normally, these issues often propagate downstream undetected. Data observability solves this by:
- Running automated validation checks.
- Monitoring expected distributions.
- Alerting on unexpected quality shifts.
This allows teams to detect data corruption before it causes business damage, without needing to write thousands of custom tests.
Missing Lineage and Dependency Visibility
Data flows are rarely linear. A single dataset may be sourced from multiple tables, transformed by various jobs, and consumed by dozens of downstream applications.
Without data lineage, it’s almost impossible to answer questions like:
- “If I change this table, what breaks?”
- “Why is this dashboard showing weird values?”
- “What’s the full upstream path of this ML feature?”
Lacking lineage forces teams to rely on tribal knowledge or reverse-engineering pipelines. Data observability tools capture lineage automatically connecting datasets, jobs, and systems so teams can trace the impact of any change or failure across the stack.
Complex Troubleshooting Across Tools
Modern pipelines span multiple systems: ingestion tools, transformation frameworks, warehouses, BI platforms, etc. During an incident, engineers often jump between:
- Orchestrator logs (e.g., Airflow)
- Job logs (e.g., Spark or dbt)
- Query history (e.g., Snowflake, BigQuery)
- Error alerts (e.g., Slack, email)
This fragmentation makes incident triage slow and painful.
Data observability solutions unify these signals, correlating them into a cohesive view. For instance, a volume anomaly can be linked to the exact pipeline run and schema change that caused it. This helps teams move from alert to root cause without wasting hours on manual investigation.
Governance and Compliance Gaps
Beyond reliability, organizations must govern data usage, especially in regulated industries. Questions like:
- “Who accessed this dataset?”
- “Did PII data end up in a non-compliant system?”
- “Can we audit the full data lineage for a financial report?”
...are hard to answer without structured observability.
Data observability integrates with governance by:
- Capturing access patterns and usage metadata.
- Tracing lineage for compliance and reporting.
- Enabling audits for data provenance and transformations.
This ensures that policies are enforced and risks are mitigated at rest and as data moves.
Summary: What Data Observability Solves in the Modern Stack
In short, data observability tackles the core pain points of the modern data stack:
Challenge | What Observability Enables |
| Pipeline Failures | Early detection, root cause, and impact analysis |
| SLA Violations / Delays | Freshness tracking, bottleneck detection |
| Silent Data Quality Failures | Automated validation and anomaly detection |
| Poor Lineage / Dependency Maps | End-to-end data flow tracing |
| Fragmented Debugging | Correlation of logs, metrics, and job metadata |
| Compliance and Data Governance | Access tracking, data provenance, and audit readiness |
With observability in place, data teams become proactive rather than reactive. They can detect and fix issues quickly and maintain trust in their data products.
In the next chapter, we’ll explore the ecosystem of tools, both open-source and commercial, that help implement data observability across your stack.
Observability as the Foundation of Reliable Data Systems
As the modern data stack grows in complexity and scale, so does the failure cost. A delayed job, a malformed dataset, or an unnoticed schema change can disrupt an organization's dashboards, models, and decisions. Traditional systems observability isn’t enough; we need data observability: the discipline of continuously tracking data assets' health, quality, and lineage from source to consumption.
In this first part, we’ve introduced:
- Why data observability has emerged as a critical capability in distributed, real-time data architectures.
- What data observability means, and how it builds on key pillars like freshness, volume, schema, quality, and lineage.
- It helps solve real-world challenges from silent failures to SLA violations and governance gaps.
These elements make data observability the operational backbone of trustworthy analytics, AI, and business intelligence. Without it, teams are flying blind, reacting to data issues only after they’ve caused damage.
What’s Next
In Part 2, we’ll explore the solutions landscape: from open-source frameworks like Great Expectations and OpenLineage, to commercial platforms like Monte Carlo, Oleander, and Metaplane. We’ll also dive deep into the emerging open standards (OpenLineage and OpenTelemetry) and how they’re laying the groundwork for truly interoperable and scalable observability architectures.
We’ll close with a strategic view: how to implement observability incrementally, align it with governance and platform maturity, and prepare for the future of autonomous, real-time observability in data engineering.
→ Stay tuned for Part 2: The Tools, Standards, and Strategies Behind Data Observability.
FAQs
Why is data observability important for analytics and AI?
What problems does data observability solve?

About the author
Dani is a data professional with a rich background in data engineering and real-time data platforms. At Estuary, Daniel focuses on promoting cutting-edge streaming solutions, helping to bridge the gap between technical innovation and developer adoption. With deep expertise in cloud-native and streaming technologies, Dani has successfully supported startups and enterprises in building robust data solutions.

