Data visualization tools help teams turn raw data into charts, dashboards, and interactive reports that support faster, better decisions. In 2026, these tools range from enterprise BI platforms and embedded analytics solutions to real-time monitoring and no-code visualization tools.
The best option depends on how you work with data: whether you need governed dashboards, live operational visibility, self-service analytics, or simple visual storytelling. This guide breaks down the leading data visualization tools, compares their strengths, and helps you choose the right one for your use case.
The best data visualization tools in 2026 are Tableau, Power BI, Looker, Qlik Sense, Kibana, Sisense, Grafana, Datawrapper, and Zoho Analytics. Each tool targets a different use case, from enterprise BI dashboards and embedded analytics to real-time monitoring and no-code visualization. The right choice depends on your data sources, scale, and the level of interactivity or real-time insight you need.
Which Data Visualization Tool Should You Choose?
Choose your data visualization tool based on how you use data and who consumes the dashboards:
- Choose Tableau if you need advanced, highly interactive dashboards for enterprise analytics and complex data exploration.
- Choose Power BI if your organization already uses Microsoft tools and you want an affordable, business-friendly BI platform.
- Choose Looker if you need governed, metrics-driven analytics built on a centralized data model, especially in cloud environments.
- Choose Qlik Sense if you want flexible, exploratory analysis that lets users freely navigate and discover relationships in data.
- Choose Grafana if you need real-time dashboards for monitoring infrastructure, applications, or time-series data.
- Choose Kibana if your primary use case is log analysis, security monitoring, or operational analytics on Elasticsearch data.
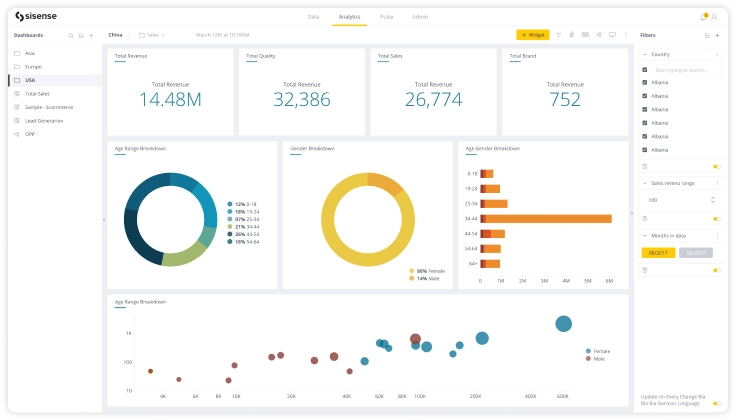
- Choose Sisense if you need embedded analytics inside customer-facing or internal applications.
- Choose Datawrapper if you want fast, no-code visualizations for reports, media, or public data sharing.
- Choose Zoho Analytics if you are a small or mid-sized business looking for an affordable, easy-to-use analytics tool.
Comparison Table: Best Data Visualization Tools in 2026
This table compares the leading data visualization tools based on primary use case, real-time capability, ease of use, and best-fit teams.
| Tool | Primary Use Case | Real-Time Support | Ease of Use | Best For | Main Trade-Off |
|---|---|---|---|---|---|
| Tableau | Interactive BI dashboards & exploration | Limited (near real-time via extracts) | Medium | Business analysts, enterprise BI teams | Higher cost, learning curve for advanced features |
| Power BI | Microsoft-centric BI & reporting | Yes (with streaming datasets) | Easy–Medium | Teams using Excel, Azure, Office 365 | Less flexible outside Microsoft ecosystem |
| Looker | Centralized metrics & governed analytics | Near real-time | Medium–High | Data teams needing consistent metrics | Requires data modeling expertise |
| Qlik Sense | Associative analytics & exploratory analysis | Near real-time | Medium | Users needing flexible data exploration | Performance issues with very large datasets |
| Kibana | Log analytics & operational monitoring | Yes (real-time) | Medium–High | IT, security, and observability teams | Requires Elasticsearch expertise |
| Sisense | Embedded analytics & high-performance BI | Near real-time | Medium | Product teams embedding analytics | Complex setup, higher cost |
| Grafana | Metrics, monitoring & time-series dashboards | Yes (real-time) | Medium | DevOps, SRE, infrastructure teams | Not designed for business BI |
| Datawrapper | Simple charts & public-facing visuals | Limited | Very Easy | Journalists, content teams | Limited advanced analytics |
| Zoho Analytics | SMB analytics & reporting | Near real-time | Easy | Small to mid-sized businesses | Less powerful for complex use cases |
What is Data Visualization?
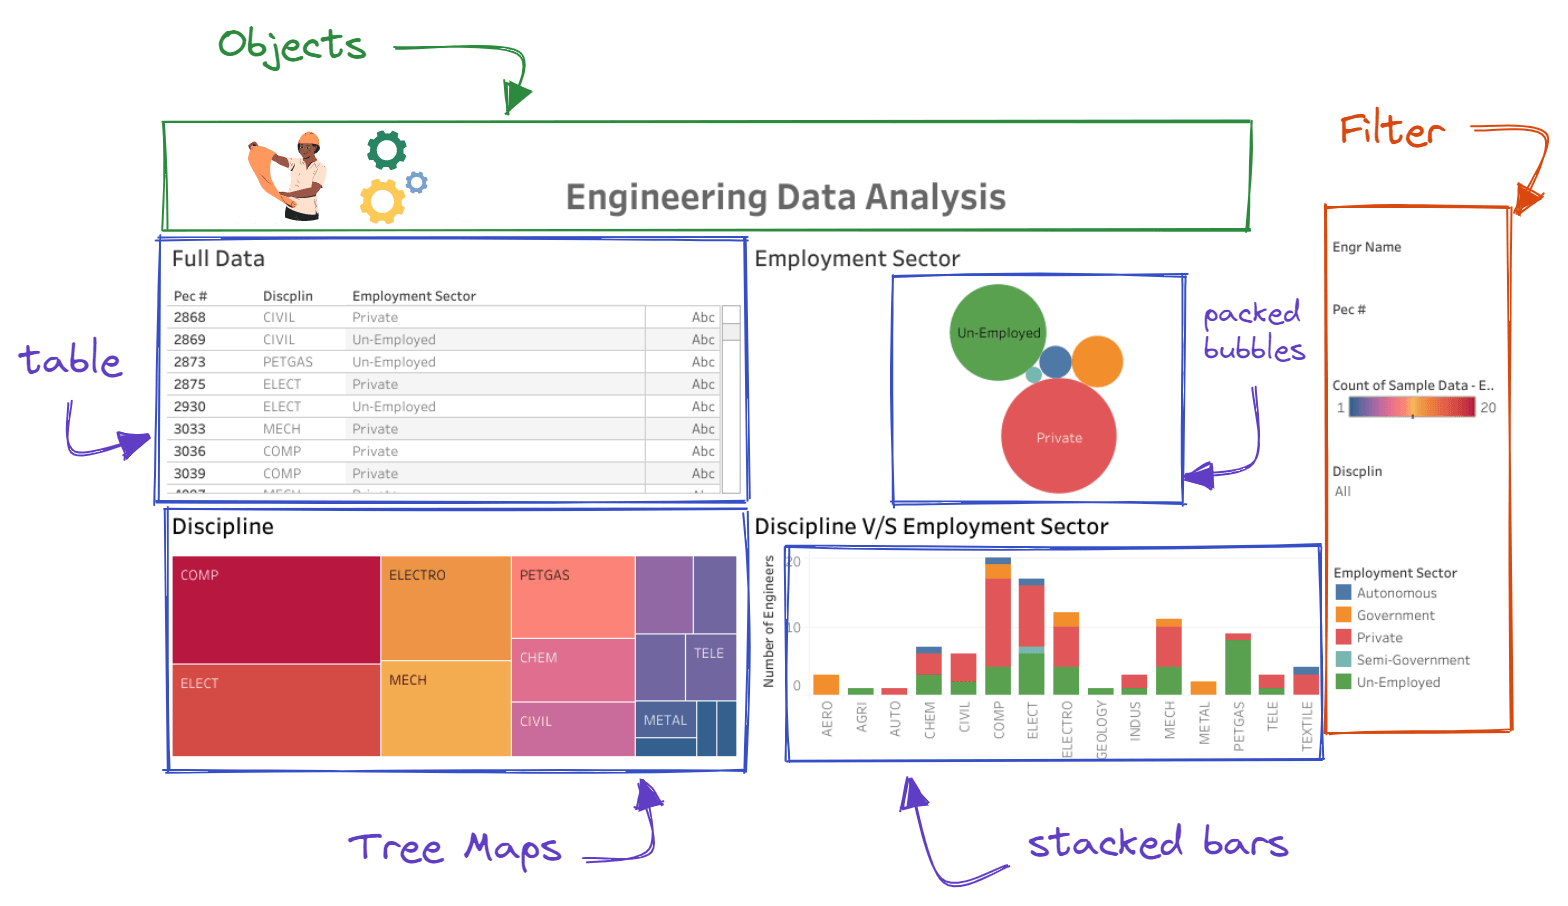
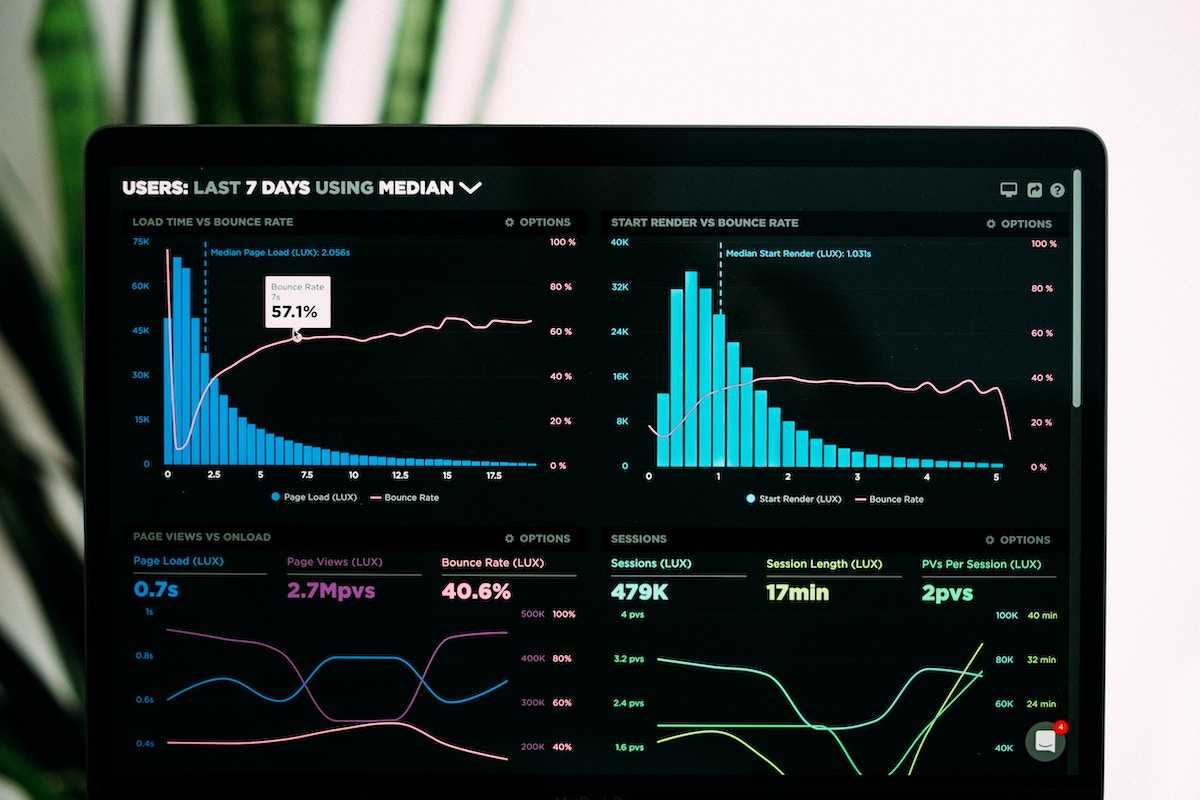
Data visualization translates data into visual elements such as charts, graphs, and maps. It helps decision-makers see analytics visually, enabling them to grasp difficult concepts or identify new patterns. With the volume of data increasing exponentially, effective visualization tools are essential for extracting meaningful insights.
Top 9 Tools for Data Visualization
Now that you have a good understanding of data visualization, let’s unleash the full potential of your data with these innovative tools designed to bring clarity to the most complex data sets.
Here is a list of the top Data Visualization tools:
1. Tableau
Best for: Interactive BI dashboards, ad-hoc analysis, and visual data exploration across large business teams
Not ideal for: Budget-constrained teams or use cases that require real-time streaming dashboards
Tableau is renowned for its intuitive interface and robust visualization capabilities, making it a top choice for data professionals. This tool helps users create interactive and shareable dashboards that make complex data easy to understand. Tableau’s strength lies in its ability to transform raw data into visually appealing and informative graphics, facilitating better decision-making processes.
Key Features:
- Dynamic Dashboards: Create interactive visuals with drill-down capabilities, data filtering, and modification features. This feature is particularly useful for identifying trends and anomalies within large datasets.
- Enhanced Data Reliability: Tableau Catalog offers comprehensive data cataloging and metadata to ensure data accuracy and trust. This feature is essential for organizations that prioritize data governance and compliance.
- Data Exploration: The Explain Data feature simplifies the process of defining relationships within datasets, making it easier to uncover key insights. By automatically generating explanations for data points, users can quickly uncover key insights without extensive data manipulation.
Pros:
- User-friendly interface: Tableau’s drag-and-drop functionality makes it accessible for users with varying levels of technical expertise, allowing even non-technical users to create sophisticated visualizations.
- Robust community support: Tableau boasts a large and active user community, providing a wealth of resources, forums, and tutorials that enhance the user experience and facilitate learning.
Cons:
- High cost: Tableau’s licensing fees can be a barrier for small to medium-sized businesses, making it less accessible for organizations with limited budgets.
- Steep learning curve: While the interface is user-friendly, mastering Tableau’s advanced features and functionalities can require significant time and effort, especially for users new to data visualization.
Use Cases: Tableau is widely used across industries such as finance, healthcare, and retail to create interactive and shareable dashboards.
2. Power BI
Best for: Organizations using Microsoft tools that want affordable, business-friendly dashboards and reporting
Not ideal for: Complex, non-Microsoft data stacks or advanced real-time analytics use cases
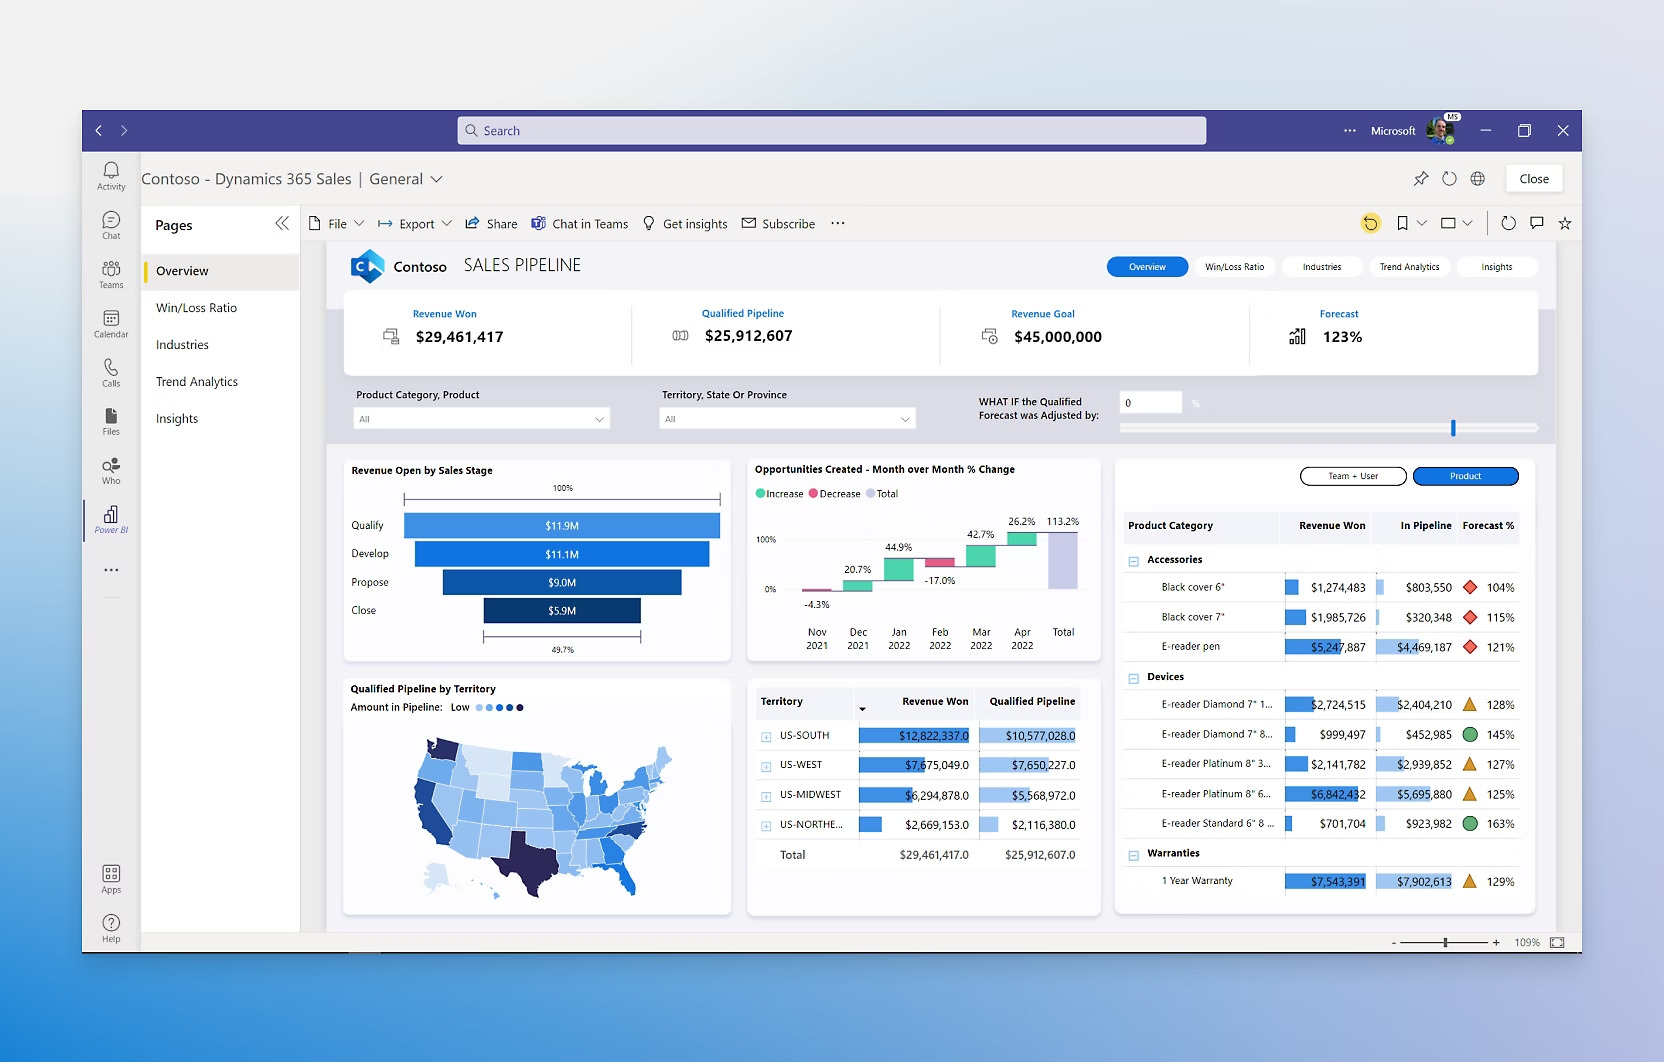
For businesses utilizing Microsoft products, Power BI offers an integrated and robust solution for data visualization, enhancing their analytics capabilities. This tool offers real-time data visualization and seamless integration with other Microsoft products, making it a versatile option for businesses of all sizes.Power BI enables users to transform raw data into insightful reports and dashboards that can be easily shared across the organization, fostering a culture of data-driven decision-making.
Key Features:
- Data Connectivity: Enables connections to diverse data sources, including Excel spreadsheets, cloud databases, and on-premises systems. This flexibility ensures that businesses can leverage existing data infrastructure without significant overhauls.
- User-Friendly Interface: Tailored for both novice and experienced users, offering simple data modeling to complex analytics.
- Power Query: This feature enables users to perform Extract, Transform, Load (ETL) data processing efficiently. With Power Query, users can filter, pivot, group, and manipulate text data, streamlining the data preparation process.
- Automated Updates: Schedule data refreshes to automate pipeline updates, reducing the need for manual intervention. This feature minimizes manual intervention by scheduling regular data refreshes, ensuring that reports and dashboards always display the latest information.
Pros:
- Affordable: Compared to many other analytics tools, Power BI offers a cost-effective solution, making it accessible for businesses of all sizes.
- Seamless integration with Office 365: The integration with Microsoft Office 365 enhances productivity by allowing users to work within familiar applications and share insights effortlessly.
Cons:
- Limited in-depth analytical capabilities
Use Cases: Power BI is ideal for businesses looking to leverage real-time data visualization and integration with existing Microsoft tools. It’s particularly beneficial in sectors such as finance, where real-time insights into financial performance are crucial, and in retail, where sales data can be analyzed to optimize inventory and marketing strategies.
Checkout some best Power BI Dashboards
3. Looker
Best for: Governed, metrics-driven analytics built on a centralized semantic data model
Not ideal for: Teams that want quick, ad-hoc dashboards without data modeling overhead
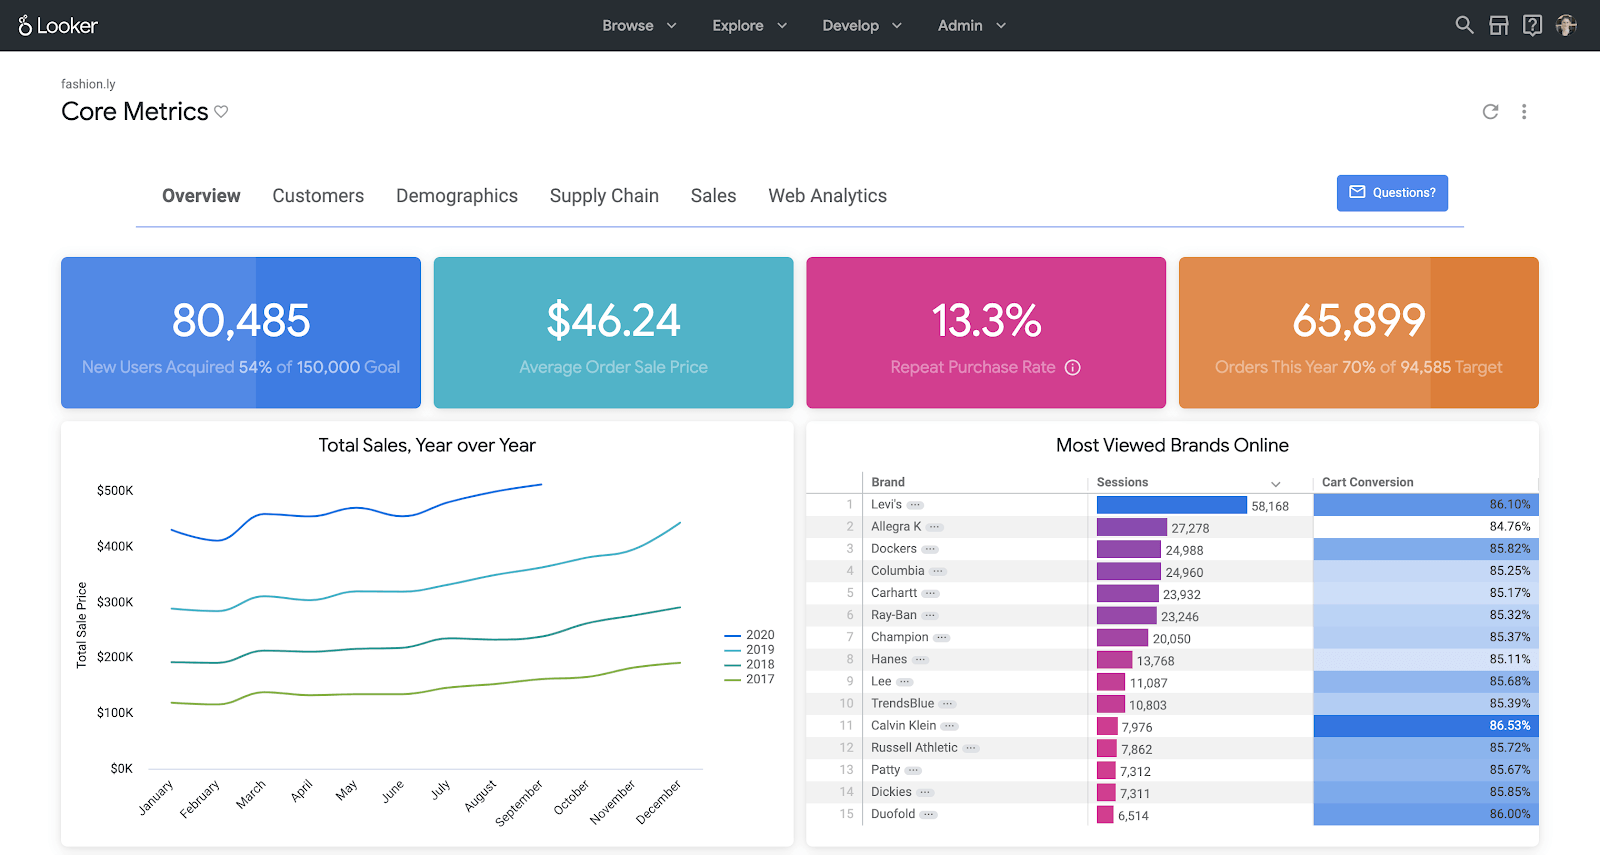
Looker, now part of Google Cloud, has revolutionized data exploration with its modern interface and robust data modeling capabilities. This tool enables teams to collaborate on data analysis, making it easier to uncover insights and make data-driven decisions. Looker’s unique approach to data modeling allows users to define metrics and dimensions in a centralized manner, promoting consistency and accuracy across reports.
Key Features:
- Data Exploration and Collaboration: Looker provides robust tools for data exploration, allowing teams to dive deep into datasets collaboratively. Users can create shared reports and dashboards, fostering a culture of data-driven decision-making across departments.
- Google Cloud Integration: As part of the Google Cloud ecosystem, Looker seamlessly integrates with various Google services, enhancing data processing and storage capabilities. This integration allows businesses to harness the power of Google’s infrastructure for scalable data analytics.
- Customizable Dashboards: Looker enables users to design and customize dashboards tailored to specific business needs. This flexibility ensures that stakeholders can access the insights most relevant to their roles.
Pros:
- Modern interface: Looker’s user-friendly and visually appealing interface makes it easy for users to navigate and interact with data, reducing the learning curve for new users.
- Strong data modeling: The tool’s robust data modeling capabilities allow organizations to define metrics and dimensions centrally, ensuring consistency in reporting and analysis.
Cons:
- Steeper learning curve: While Looker is powerful, its advanced features may require more time to master, particularly for users unfamiliar with data modeling concepts.
- Higher cost: Looker’s pricing can be a consideration for smaller organizations, as it may be more expensive compared to other visualization tools.
Use Cases: Looker is extensively used in tech companies and startups for detailed data exploration and collaborative analytics. It’s particularly effective in environments where teams need to share insights quickly and work together on data-driven projects, such as product development and marketing analysis. This expanded content provides a more comprehensive overview of Power BI and Looker, highlighting their unique features, advantages, and specific use cases in various business contexts.
4. Qlik Sense
Best for: Exploratory analytics where users need to freely navigate and discover relationships in data
Not ideal for: Very large datasets requiring strict query-based performance optimization
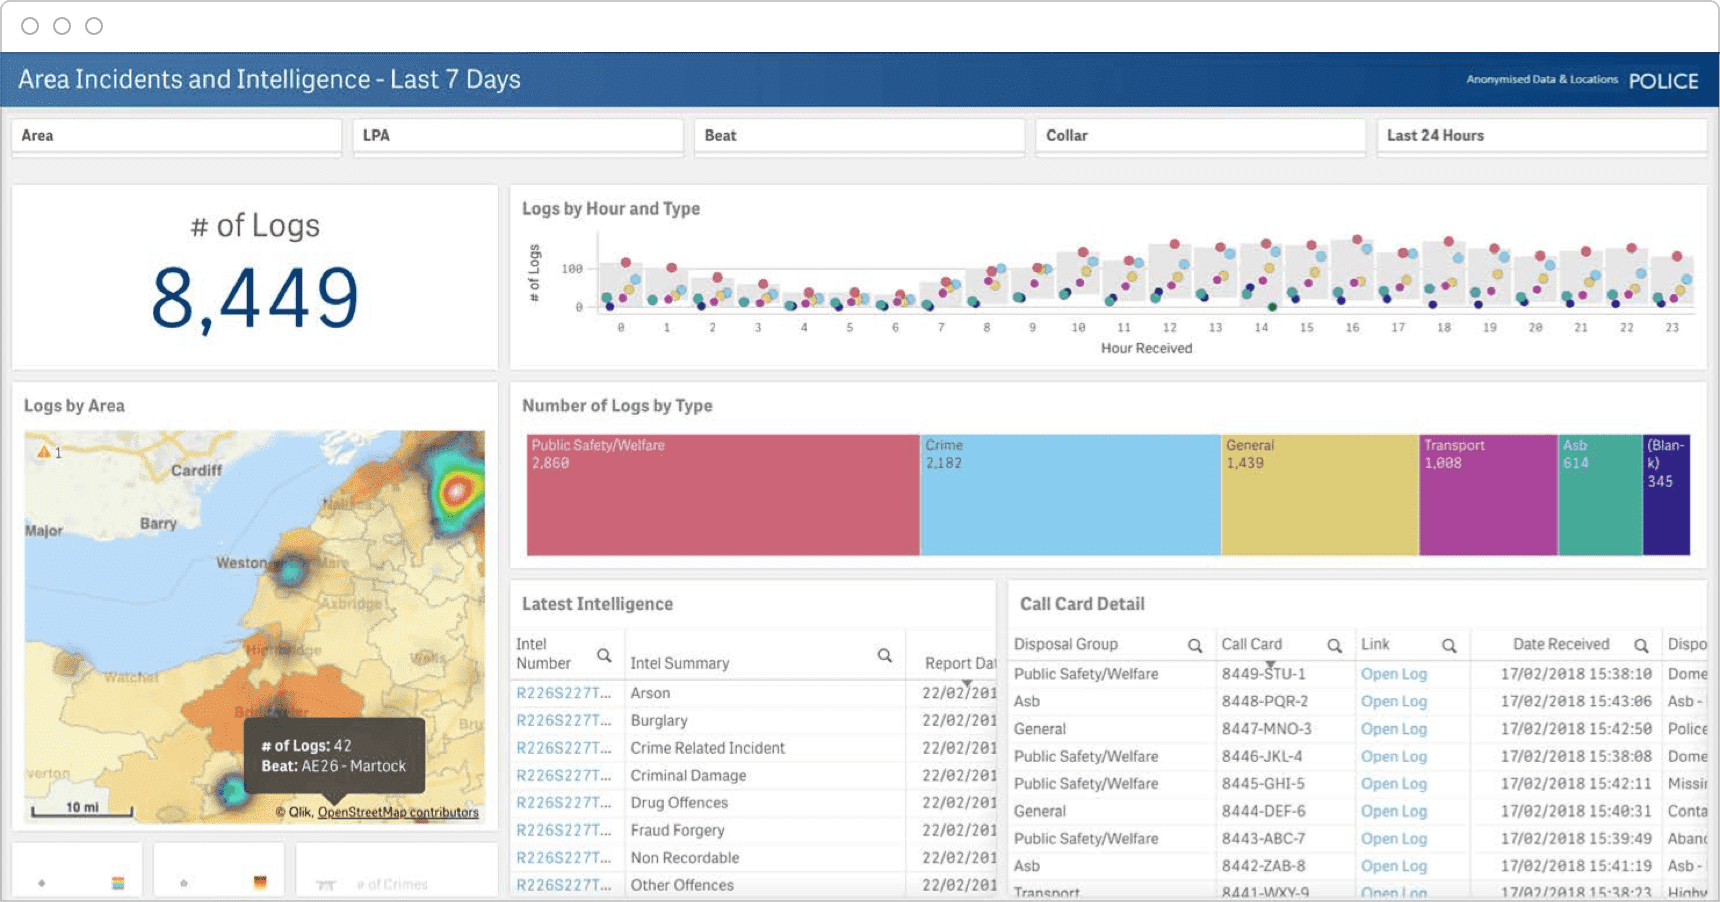
Qlik Sense stands out in the crowded field of data visualization tools with its innovative associative data model and AI-driven insights. This platform allows users to explore data freely and uncover hidden patterns without being restricted by query-based tools. Qlik Sense empowers users to make data-driven decisions by providing a comprehensive view of their data landscape.
Key Features:
- Associative Data Model: Unlike traditional hierarchical data models, Qlik Sense's associative model allows users to navigate through data intuitively. This feature enables users to explore data from multiple angles, revealing insights that may not be apparent through linear queries.
- AI-Driven Insights: The tool leverages artificial intelligence to provide contextual insights, helping users understand their data more intuitively. This functionality enhances the user experience by suggesting relevant data points and trends based on user interactions.
- Self-Service Data Exploration: Qlik Sense empowers users to conduct self-service data exploration and analysis without relying on IT departments. This flexibility allows business users to create their own reports and dashboards, fostering a culture of data independence.
Pros:
- Flexible data exploration: Users can easily interact with their business data in a non-linear fashion, making it easier to identify trends and correlations.
- Strong analytics capabilities: Qlik Sense offers robust analytical tools that support complex calculations and visualizations, making it suitable for advanced data analysis.
Cons:
- Performance issues with large datasets: Some users report performance slowdown when they are working with large datasets, which can prevent and impact real-time analysis.
Use Cases: Qlik Sense is used in industries like healthcare, manufacturing, and logistics to uncover hidden insights and make data-driven decisions.
5. Kibana
Best for: Log analysis, security monitoring, and operational dashboards on Elasticsearch data
Not ideal for: Traditional business intelligence or non-technical business users
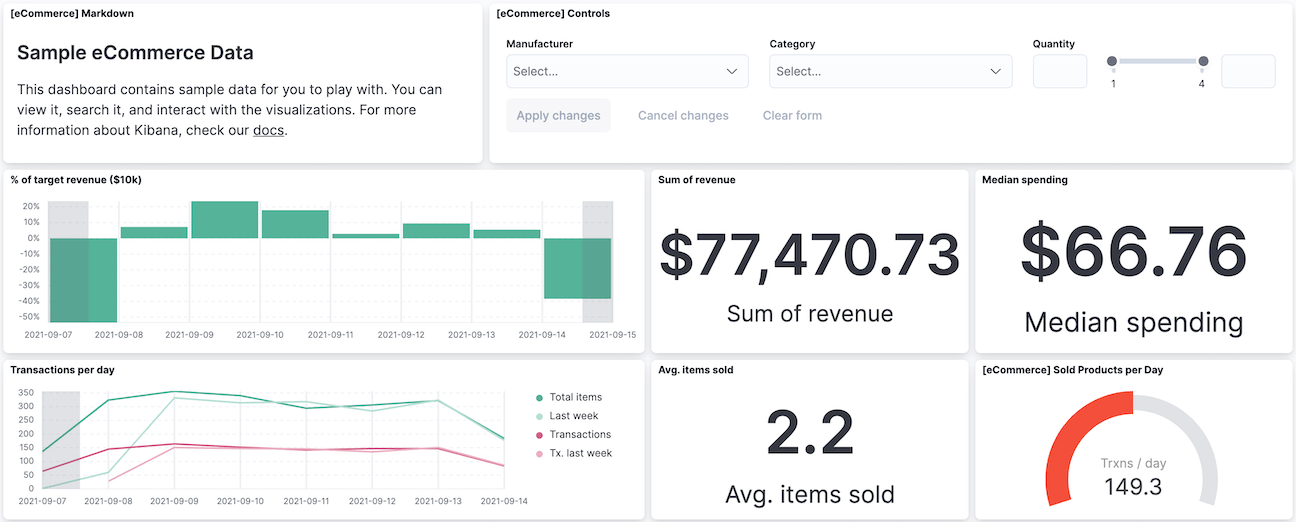
Kibana stands out with its real-time data visualization and integration with Elasticsearch. It’s a powerful tool for those who need advanced filtering and querying capabilities. It is widely used in IT and cybersecurity for monitoring and analyzing large-scale data in real-time, making it an essential tool for organizations that require advanced filtering and querying capabilities.
Key Features:
- Data Visualization: Kibana offers a diverse range of visualization options, from basic charts to complex heat maps and pie charts. This variety allows users to choose the best representation for their data.
- Elasticsearch Integration: Designed to work seamlessly with Elasticsearch for real-time data processing and visualization.
- Dashboard Creation: Allows for the creation of customized, shareable dashboards to meet specific business needs.
- Kibana Lens: This user-friendly feature provides a drag-and-drop interface for data exploration and visualization, simplifying the process for users with varying levels of technical expertise.
- Alerts and Notifications: Set up alerts and notifications based on specific data conditions or thresholds.
Pros:
- Powerful search and analytics: Kibana's integration with Elasticsearch provides powerful search capabilities, enabling users to analyze vast amounts of data quickly.
- Open-source: As an open-source tool, Kibana offers flexibility and a strong community for support and development.
Cons:
- Requires technical expertise: While Kibana is powerful, it may require a certain level of technical knowledge to set up and configure effectively.
- Can be challenging to configure: Setting up and integrating with Elasticsearch can be difficult, especially for organizations lacking dedicated IT resources.
Use Cases: Kibana is commonly used in IT and cybersecurity for monitoring and analyzing large-scale data in real-time. Its ability to visualize data from various sources makes it invaluable for security teams looking to identify potential threats quickly.
6. Sisense
Best for: Embedded analytics inside customer-facing or internal applications
Not ideal for: Teams looking for a lightweight, low-cost standalone BI tool
Sisense brings speed and performance to the forefront with its in-chip analytics and embedded capabilities. This tool is designed to handle large volumes of data quickly, making it a go-to for high-performance analytics.
Key Features:
- In-Chip Analytics: Sisense leverages in-chip technology to accelerate data processing and analytics, allowing users to analyze large datasets quickly without compromising performance.
- Embedded Analytics: This feature enables organizations to embed analytics capabilities directly into their applications, providing users with seamless access to insights within their existing workflows.
- User-Friendly Interface: Sisense is designed to be accessible for both technical and non-technical users, making it easy for teams across the organization to leverage data insights.
Pros:
- High performance: Sisense's architecture allows for rapid data processing, making it suitable for organizations that need to analyze large datasets in real-time.
- Scalable: The platform can scale to accommodate growing data needs, making it a suitable choice for rapidly expanding businesses.
Cons:
- Complex setup: Initial setup can be complex, particularly for organizations without prior experience in data analytics tools.
- Higher cost: Sisense may come with a higher price tag compared to other tools, which can be a consideration for budget-conscious organizations.
Use Cases: Sisense is favored in industries like e-commerce, telecommunications, and healthcare for its scalable and high-performance analytics. In e-commerce, for example, it can analyze customer behavior and sales trends to optimize marketing strategies and improve customer experiences.
7. Grafana
Best for: Real-time monitoring of infrastructure, applications, and time-series metrics
Not ideal for: Business reporting or complex relational data analysis
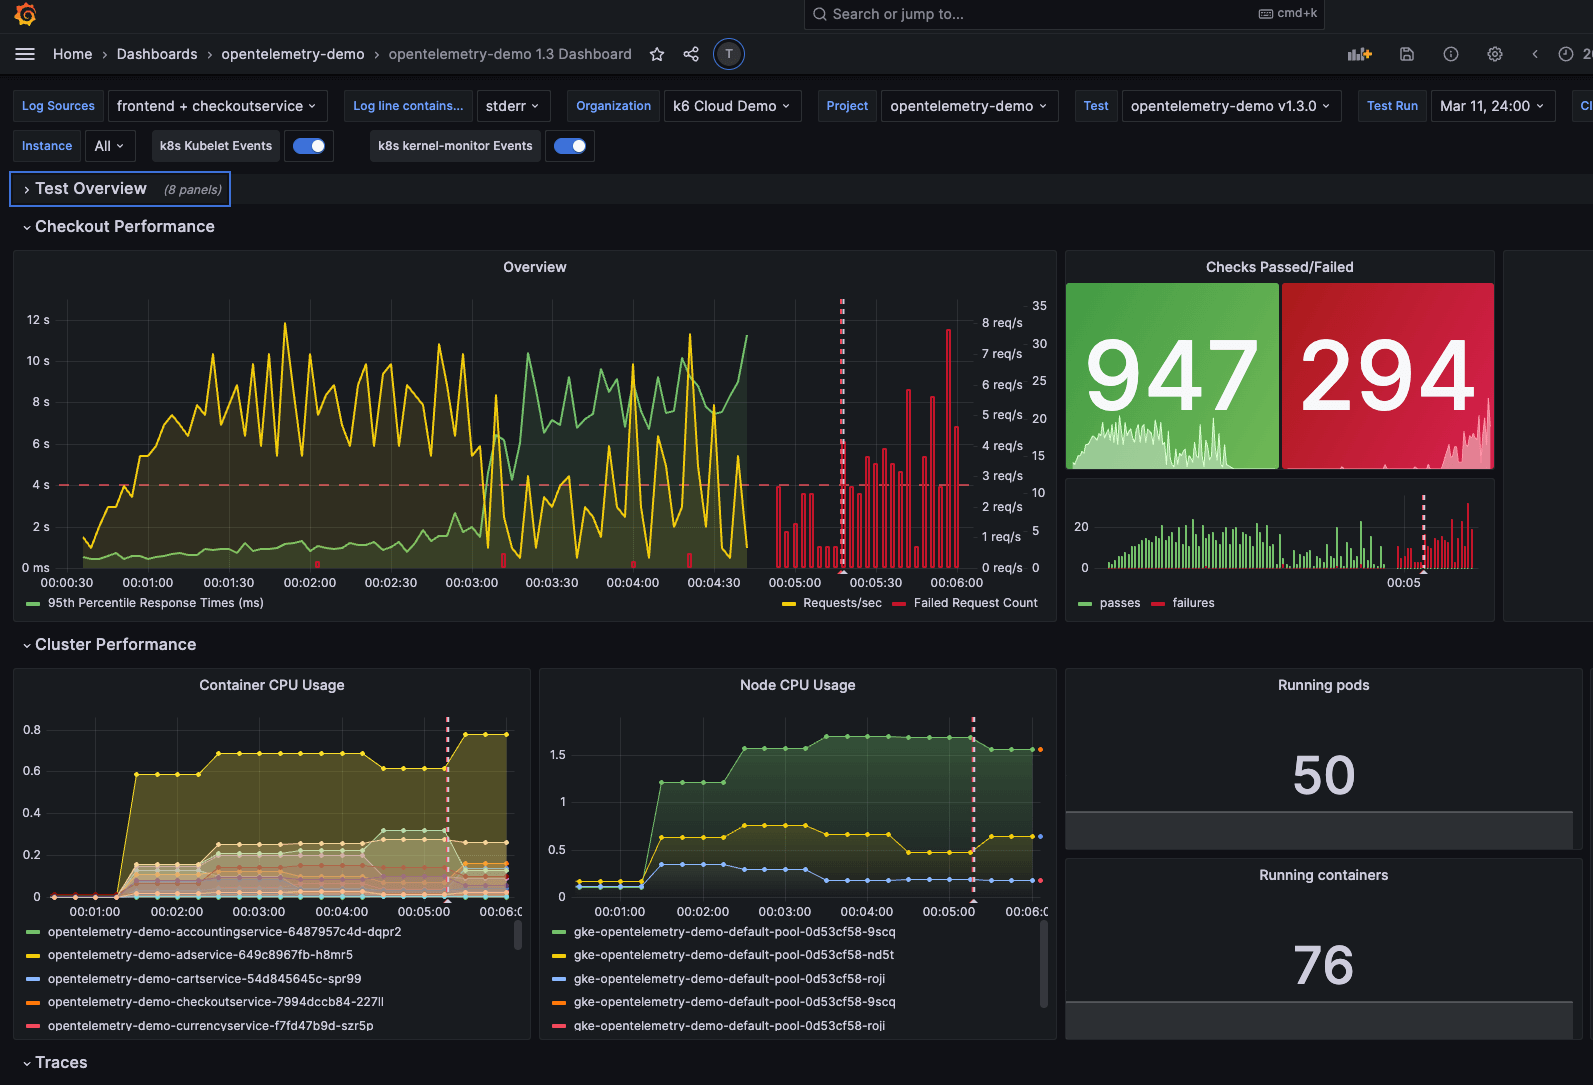
Grafana stands out as a versatile open-source tool, renowned for its extensive flexibility and customization capabilities. It excels in real-time monitoring and is highly favored by DevOps and IT operations teams that require immediate insights into system performance and health. Grafana's ability to visualize data from multiple sources allows organizations to create comprehensive dashboards that provide a holistic view of their operational metrics.
Key Features:
- Data Connectivity: Supports a wide range of data sources for comprehensive data analysis, including relational databases, time-series databases, and cloud services, enabling comprehensive data analysis across different platforms.
- User-Friendly Interface: Features a simple and intuitive interface for creating and customizing dashboards.
- Powerful Query Editor: Grafana’s query editor allows users to write and execute complex queries, providing the flexibility to analyze data in depth. This feature is crucial for users who need to extract specific insights from large datasets.
- Alerts and Notifications: Set up alerts and notifications to stay informed about critical data changes.
- Plugins and Extensibility: Offers a variety of plugins to extend functionality and integrate with other tools.
Pros:
- Cost-Effective: Being open-source, Grafana is a budget-friendly option for organizations looking to implement powerful data visualization without significant costs.
- Highly Flexible: The extensive customization options allow users to tailor dashboards to meet specific operational needs, making Grafana suitable for diverse use cases.
Cons:
- Requires technical knowledge: While the interface is user-friendly, setting up and configuring Grafana to its full potential may require some technical expertise.
- Limited out-of-the-box features: Users may need to invest time in customizing the tool to get the most out of it, as it does not come with extensive pre-built dashboards.
Use Cases: Grafana is widely used in DevOps and IT operations for real-time monitoring and analytics. It is particularly effective for tracking system performance, application metrics, and infrastructure health, allowing teams to respond quickly to issues as they arise.
8. Datawrapper
Best for: Fast, no-code data visualizations for reports, media, and public data sharing
Not ideal for: Advanced analytics, large datasets, or internal BI platforms
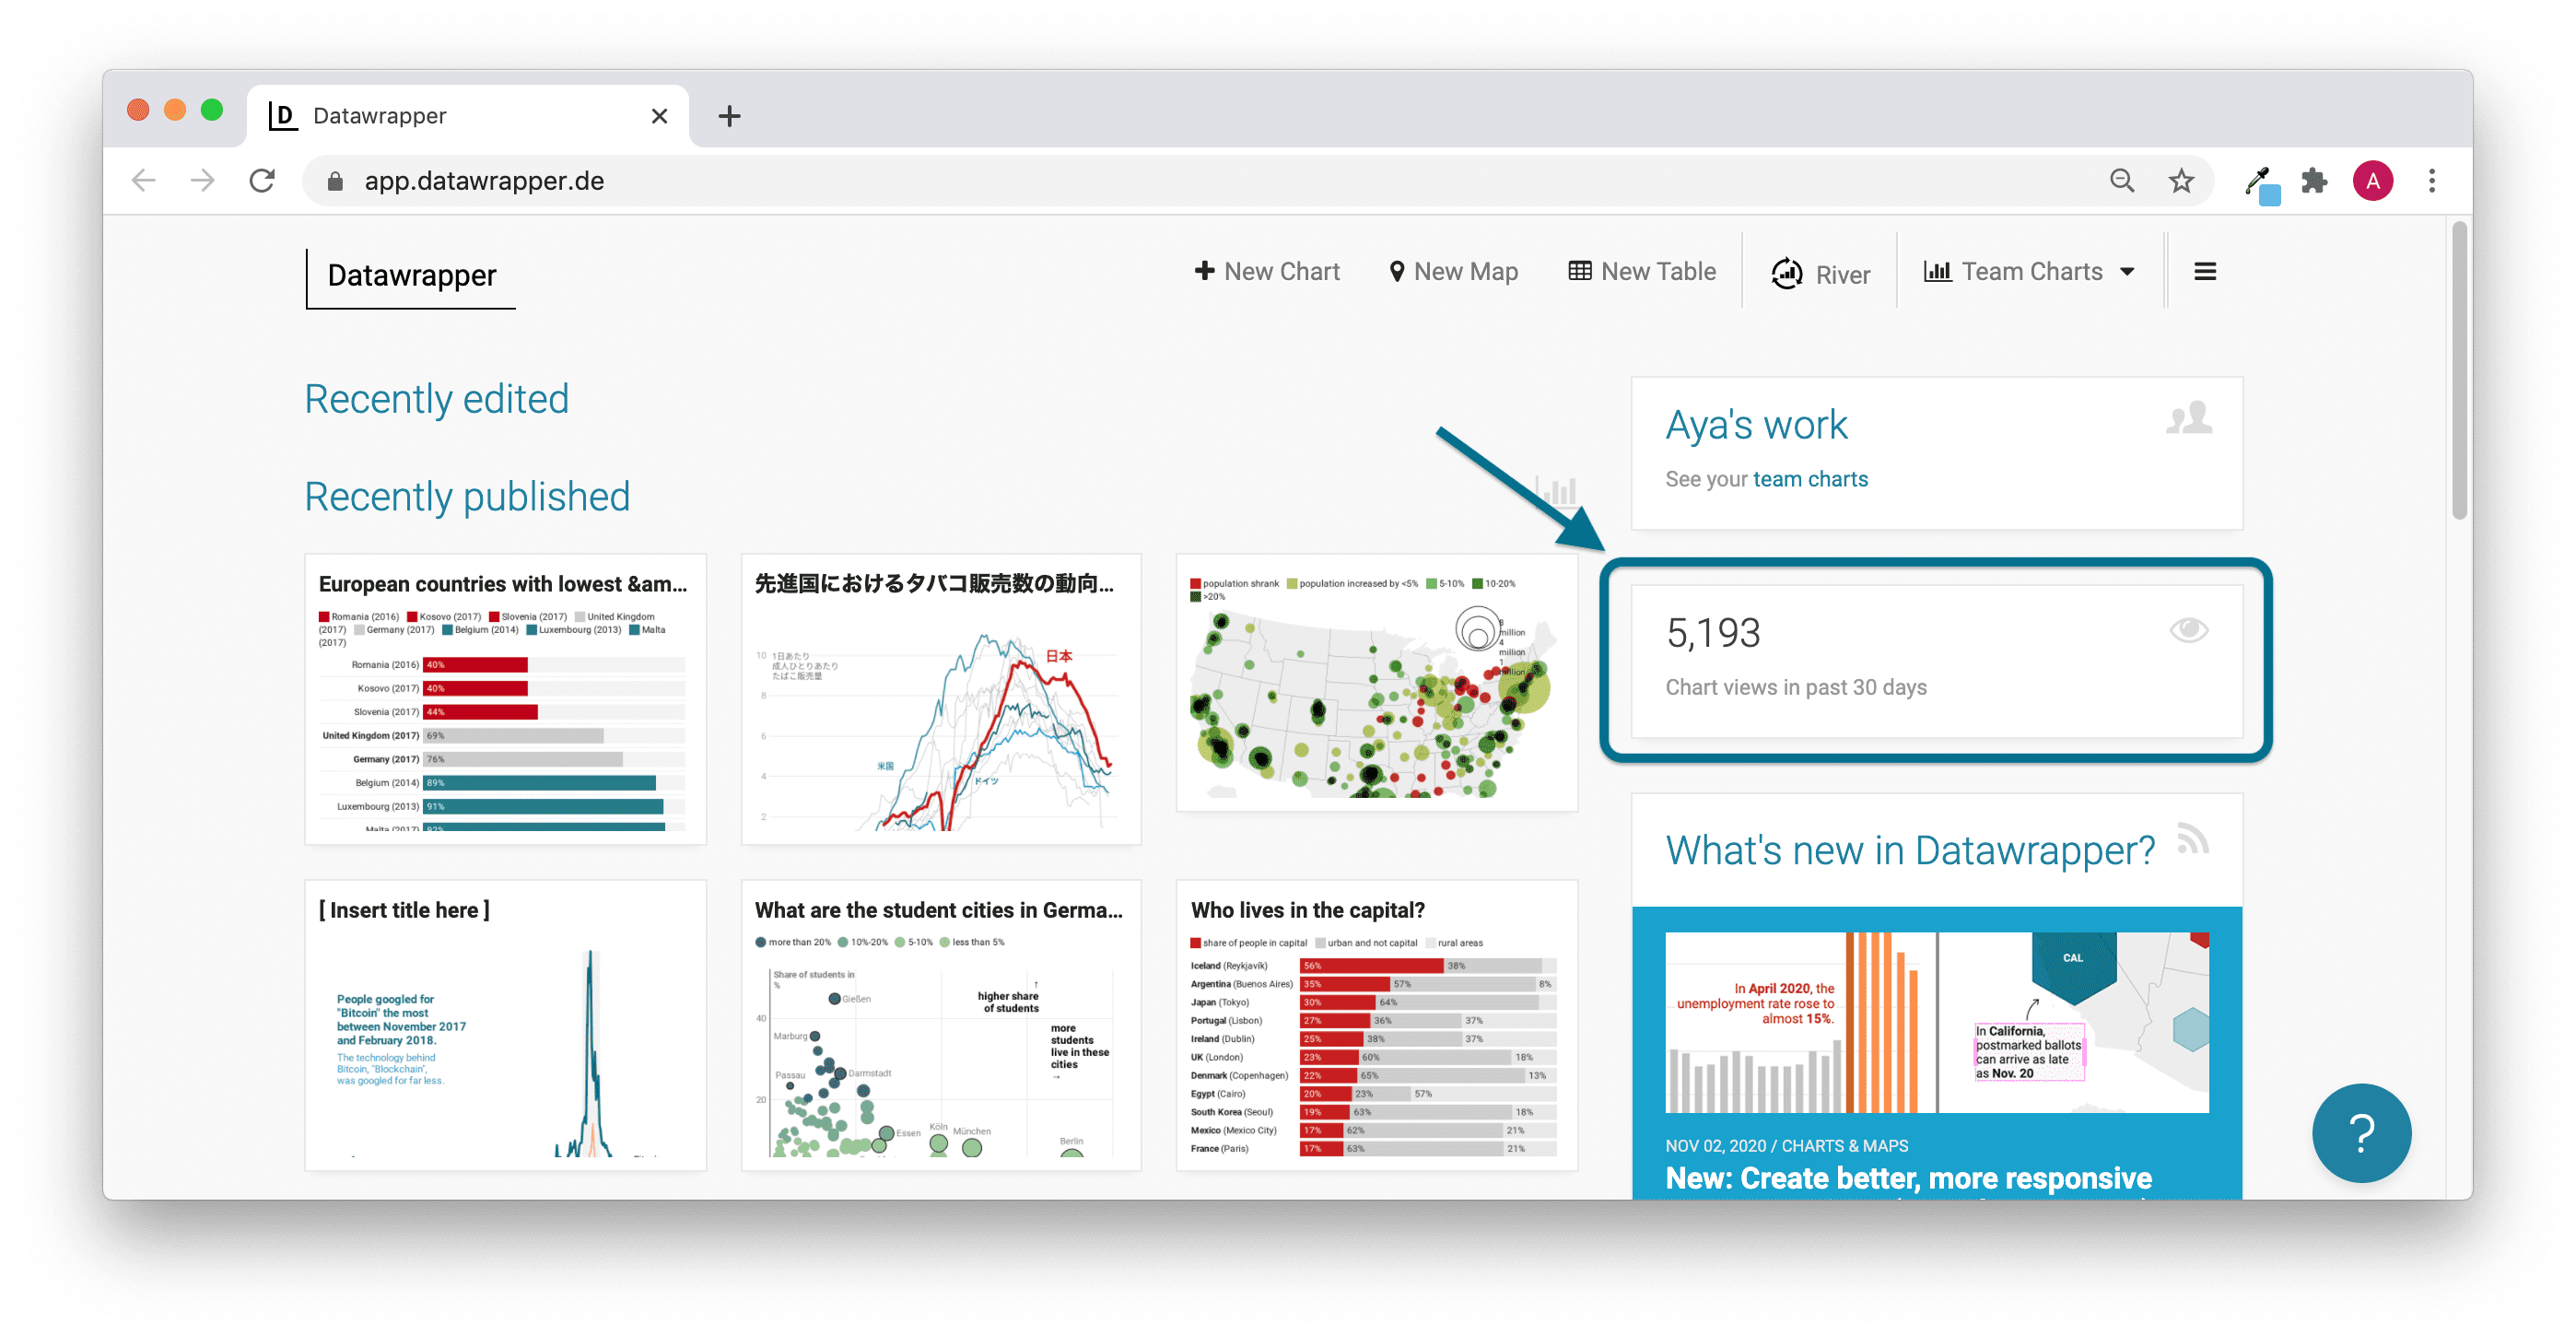
Datawrapper is a user-friendly tool designed for quick and easy data visualization. It’s particularly popular among journalists and non-technical users for its simplicity and speed.
Key Features:
- Ease of Use: Datawrapper allows users to create visualizations without any coding skills, enabling them to import data easily from CSV files or Google Sheets. This accessibility is a significant advantage for users who may not have a background in data analysis.
- Wide Range of Visualization Options: Supports various chart types, including bar charts, line charts, maps, and scatter plots.
- Responsive Design: Datawrapper ensures that visualizations adapt to different screen sizes, making them easy to share and embed across platforms, including websites and social media.
- Real-Time Data Integration: Allows for real-time data updates, ensuring that visualizations reflect the most current information.
- Security and Collaboration: Datawrapper provides robust security measures and collaboration features for team-based projects.
Pros:
- User-friendly: The intuitive interface allows users to create visualizations quickly, making it ideal for those who need to produce graphics on tight deadlines.
- Quick setup: Users can get started with minimal setup time, allowing for rapid deployment of visualizations.
Cons:
- Limited advanced analytics features: While Datawrapper excels in visualization, it may lack some of the advanced analytical capabilities found in more robust analytics platforms.
Use Cases: Datawrapper is popular in media and journalism for creating quick, effective data visualizations.
9. Zoho Analytics
Best for: Small and mid-sized businesses that need affordable, easy-to-use analytics
Not ideal for: Enterprise-scale analytics or highly customized data modeling
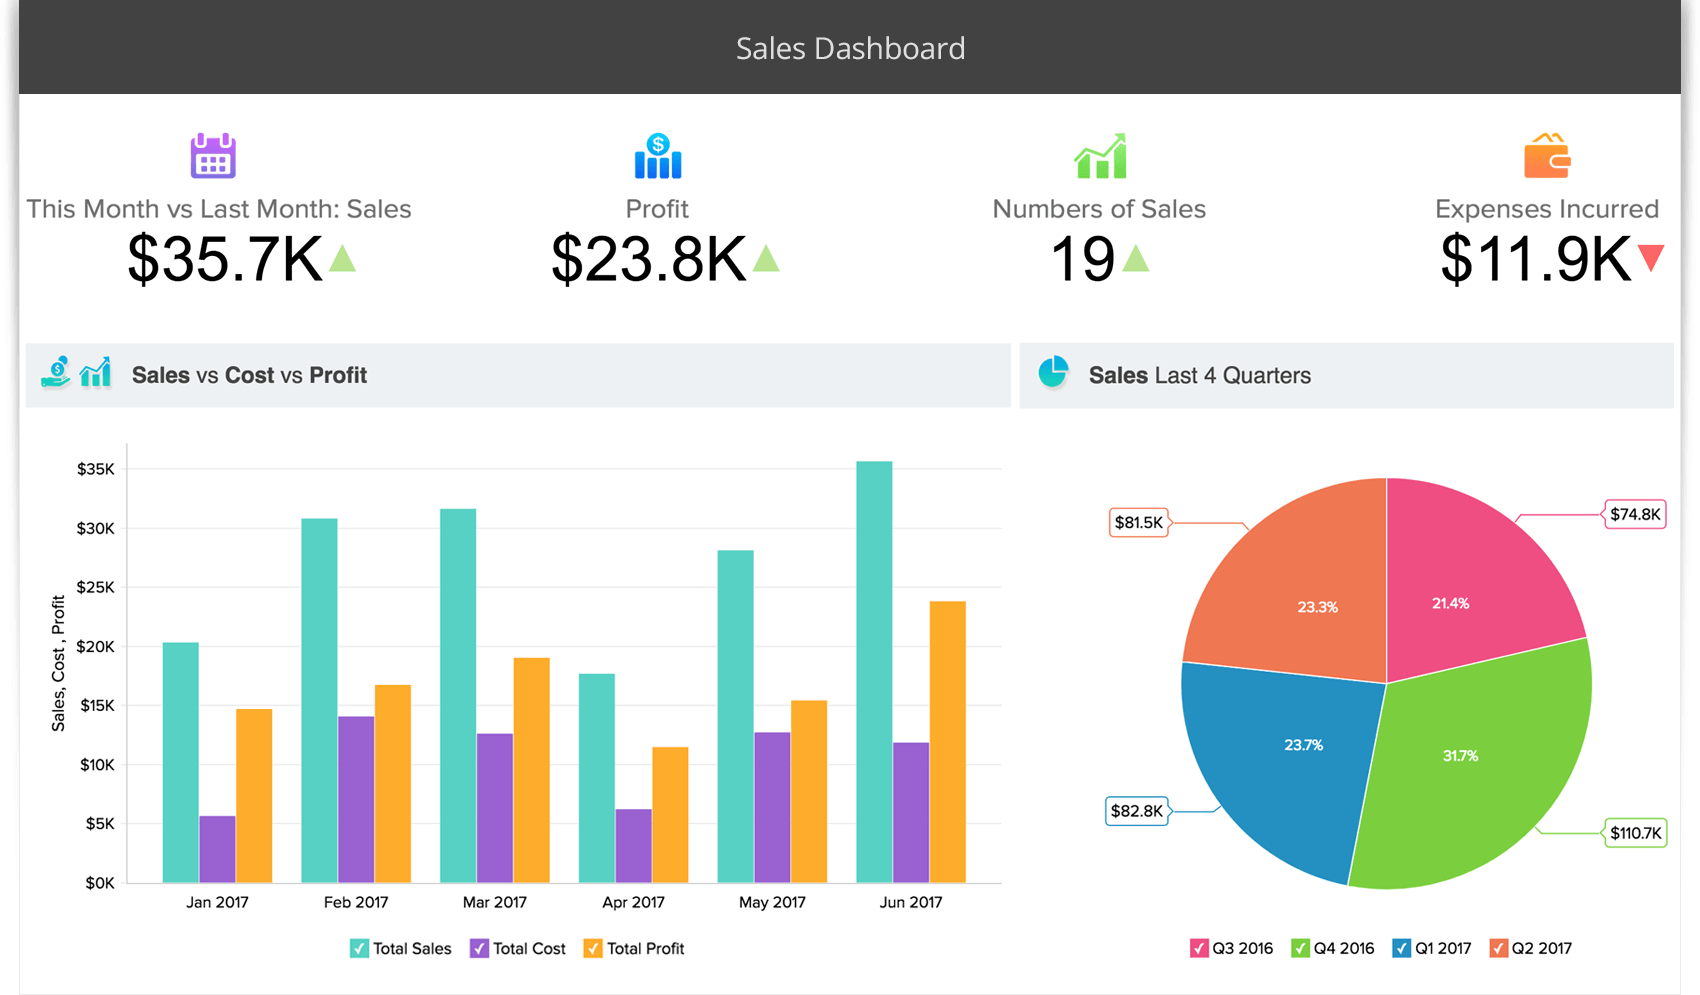
Zoho Analytics combines AI-powered analytics with an easy-to-use interface, making it a strong contender in the data visualization space. Its affordability and ease of use are major pluses. Its affordability and user-friendly design appeal to small to medium-sized businesses looking for effective analytics solutions without breaking the bank.
Key Features:
- AI-Powered Analytics: Zoho Analytics leverages artificial intelligence to provide advanced analytics and predictive insights, helping users identify trends and make data-driven decisions.
- User-Friendly Interface: Designed to be easy for all users, regardless of their skill level.
- Integration with Various Data Sources: Zoho Analytics supports integration with multiple data sources, including cloud applications and databases, enabling comprehensive analysis across different platforms.
Pros:
- Affordable: Zoho Analytics offers competitive pricing, making it an attractive option for organizations with budget constraints.
- Easy to Use: The intuitive interface allows users to create reports and dashboards quickly, facilitating faster insights and decision-making.
Cons:
- Limited advanced features: While Zoho Analytics is user-friendly, it may not offer the depth of features found in more specialized analytics platforms, which could be a limitation for advanced users.
Use Cases: Zoho Analytics is ideal for small to medium-sized businesses looking for cost-effective and user-friendly analytics solutions.
How to Choose the Best Data Visualization Tool
Choosing the right data visualization tool depends on how your organization analyzes data, who builds dashboards, and how insights are consumed. There is no single “best” tool for every team. The right choice aligns with your data sources, use cases, and operational constraints.
1. Primary Use Case
Start by identifying what you need visualizations for:
- Business intelligence and reporting: Tools like Tableau, Power BI, Looker, and Qlik Sense are designed for KPI tracking, dashboards, and ad-hoc analysis.
- Real-time monitoring and observability: Grafana and Kibana are better suited for time-series metrics, logs, and operational data.
- Embedded analytics: Sisense is commonly used when dashboards must be embedded inside applications.
- Public or lightweight reporting: Datawrapper works well for fast, shareable visuals without heavy analytics requirements.
2. Audience and Skill Level
Consider who will create and consume dashboards:
- Business users: Power BI, Tableau, and Zoho Analytics offer low-code or no-code experiences.
- Data analysts: Tableau, Looker, and Qlik Sense provide deeper exploration and modeling capabilities.
- Engineers and DevOps teams: Grafana and Kibana align better with technical workflows and monitoring use cases.
3. Data Sources and Scale
Evaluate how your data is stored and how much you analyze:
- Cloud data warehouses: Looker, Tableau, Power BI, and Sisense integrate well with modern warehouses.
- Operational and log data: Kibana and Grafana are optimized for Elasticsearch and time-series databases.
- Large or complex datasets: Tools with strong query optimization and caching handle scale more effectively.
4. Real-Time vs Batch Needs
Not all visualization tools support real-time data equally:
- Real-time dashboards: Grafana and Kibana support near-instant updates for streaming data.
- Scheduled refreshes: Most BI tools rely on periodic refreshes rather than continuous streaming.
- Hybrid needs: Some teams combine BI tools with monitoring platforms to balance freshness and performance.
5. Cost and Licensing Model
Pricing varies significantly across tools:
- Enterprise licensing: Tableau, Looker, Sisense, and Qlik Sense can be expensive at scale.
- Affordable or bundled options: Power BI and Zoho Analytics are often more budget-friendly.
- Open-source tools: Grafana and Kibana reduce licensing costs but may increase operational overhead.
6. Governance and Security
For regulated or enterprise environments:
- Look for role-based access control, data lineage, and auditability.
- Tools like Looker, Tableau, and Sisense provide stronger governance features.
- Simpler tools may require external controls for compliance.
Summary
The best data visualization tool is the one that matches your use case, users, data scale, and budget. Business intelligence, real-time monitoring, embedded analytics, and public reporting all require different capabilities. Understanding these trade-offs ensures you choose a tool that delivers insights without unnecessary complexity.
Common Data Visualization Challenges & Best Practices
Even with modern tools, teams often struggle to turn data into reliable, actionable visuals. Understanding common challenges — and how to address them — helps ensure dashboards remain accurate, trusted, and useful over time.
Challenge 1: Data Freshness and Latency
Many dashboards rely on scheduled refreshes, which can introduce delays between real-world events and what users see.
Best practices:
- Match refresh frequency to business needs rather than default schedules.
- Use real-time or near-real-time tools (such as Grafana or Kibana) for operational monitoring.
- Clearly label data freshness in dashboards to set correct expectations.
Challenge 2: Performance at Scale
As datasets grow, dashboards can become slow, especially when querying large tables or running complex calculations.
Best practices:
- Use pre-aggregations or extracts for frequently accessed metrics.
- Push heavy transformations upstream into data warehouses or ETL processes.
- Limit unnecessary visuals and filters on high-traffic dashboards.
Challenge 3: Inconsistent Metrics and Definitions
Different teams may calculate the same metric differently, leading to conflicting dashboards and loss of trust.
Best practices:
- Centralize metric definitions using semantic layers or governed models (for example, in Looker).
- Document KPIs and calculation logic.
- Restrict editing rights for critical dashboards in enterprise environments.
Challenge 4: Poor Dashboard Design
Overloaded or unclear visuals can make insights harder to understand instead of easier.
Best practices:
- Focus on a small number of key metrics per dashboard.
- Choose chart types that match the data and question being answered.
- Use consistent colors, labels, and layouts across reports.
Challenge 5: Governance and Access Control
As dashboards spread across teams, controlling who can see or edit data becomes more complex.
Best practices:
- Apply role-based access control and permissions.
- Use certified or curated datasets for executive reporting.
- Regularly audit dashboards and retire unused or outdated reports.
Challenge 6: Tool Misalignment
Using the wrong visualization tool for a use case often leads to frustration and unnecessary complexity.
Best practices:
- Use BI tools for reporting and analysis, not infrastructure monitoring.
- Use monitoring tools for logs and metrics, not business KPIs.
- Combine tools when necessary rather than forcing one platform to handle every scenario.
Summary
Successful data visualization depends on more than choosing the right tool. Teams must manage data freshness, performance, governance, and design quality to ensure dashboards remain trusted and actionable. Following these best practices helps organizations avoid common pitfalls and get consistent value from their visualization investments.
Conclusion: Choosing the Right Data Visualization Tool
There is no single best data visualization tool for every team. The right choice depends on how your organization works with data, how fresh that data needs to be, and who is consuming the insights.
Traditional BI tools like Tableau, Power BI, Looker, and Qlik Sense excel at business reporting, dashboards, and executive analytics. Monitoring-focused tools such as Grafana and Kibana are better suited for real-time operational metrics, logs, and infrastructure visibility. Platforms like Sisense and Datawrapper serve more specialized needs, including embedded analytics and rapid visual storytelling.
When selecting a data visualization tool, prioritize:
- Your primary use case (business reporting vs real-time monitoring)
- Data freshness and performance requirements
- Ease of use for your intended audience
- Governance, security, and scalability needs
- Total cost of ownership over time
In 2026, successful organizations often use more than one visualization tool, combining BI dashboards with real-time monitoring or embedded analytics where appropriate. Choosing tools that align with specific use cases — rather than forcing one platform to do everything — leads to clearer insights, better adoption, and more confident decision-making.
Also read:
FAQs
Which data visualization tool is best for beginners?
Which data visualization tools support real-time dashboards?
Tableau vs Power BI: which is better?
Are data visualization tools the same as BI tools?
Which data visualization tool is best for large enterprises?

About the author
Rob has worked extensively in marketing and product marketing on database, data integration, API management, and application integration technologies at WS02, Firebolt, Imply, GridGain, Axway, Informatica, and TIBCO.

