Introduction: Choosing the Right Observability Tools for Real-Time Data
Observability is not just about uptime dashboards—it’s about understanding systems from the inside out. For teams building with real-time and streaming data, the need for observability tools that surface granular metrics in near real time is critical.
Traditional platforms focus on infrastructure and application health. But what happens inside the data pipelines—across ingestion, transformation, and delivery—often remains a black box.
This blog explores the top observability tools for 2025, especially those built to support fast-moving, modern architectures. Ultimately, we’ll show how to extend your observability stack to include pipeline-level insights with Estuary.
Evaluation Criteria for the Best Observability Tools
When evaluating the best observability tools for streaming and real-time systems, it’s important to look beyond surface features. Here are the key factors to consider:
1. Real-Time Metrics Collection
Can the tool capture and expose metrics with minimal delay? For systems processing live data, even a few minutes of lag can make monitoring ineffective.
2. Open Standards Support
Support for standards like OpenMetrics and OpenTelemetry makes integration easier and avoids vendor lock-in. Tools that work with these standards plug into existing pipelines more smoothly.
3. Granularity and Context
Metrics should be fine-grained, not just system-level. Look for support for task-level, service-level, and ideally data-level metrics to pinpoint issues in complex architectures.
4. Visualization and Alerting
A great observability platform includes powerful visual dashboards and flexible alerting. Whether through built-in tools or integrations (e.g., Grafana, Datadog dashboards), this is essential for fast response.
5. Integrations and Ecosystem Fit
The best observability tools integrate with your infrastructure, languages, and services. A major plus is compatibility with Kubernetes, cloud services, streaming tools like Kafka, and real-time platforms.
6. Ease of Deployment and Maintenance
Complex setups can slow down adoption. Cloud-based options and Docker-native tools that support fast deployment without heavy config are ideal.
Top 5 Observability Tools for Streaming and Real-Time Systems
These are the top observability tools for 2025, trusted by engineers to monitor infrastructure, applications, and high-throughput data pipelines—all in real time.
1. Prometheus
Prometheus is one of the most widely adopted open-source observability tools for collecting, querying, and alerting on real-time metrics. Originally developed at SoundCloud, it’s now a core project under the Cloud Native Computing Foundation and forms the backbone of many modern monitoring stacks.
Why It Stands Out
- Pull-based model: Prometheus scrapes metrics from configured endpoints on a schedule, making it ideal for dynamic systems like Kubernetes and microservices.
- Flexible query language: With PromQL, you can perform sophisticated slicing, filtering, and aggregations over time-series data.
- Efficient storage engine: Built-in time-series database stores metrics in a compressed format for fast queries.
- Strong ecosystem: Works natively with Grafana, Alertmanager, and hundreds of exporters to monitor everything from system load to Kafka consumer lag.
Real-Time Use Case
Prometheus is especially effective for teams operating streaming or event-driven systems, where real-time alerting is crucial. It's commonly used to monitor message queue lag, CPU and memory trends in streaming applications, and system-level bottlenecks in ETL workflows.
Estuary Integration
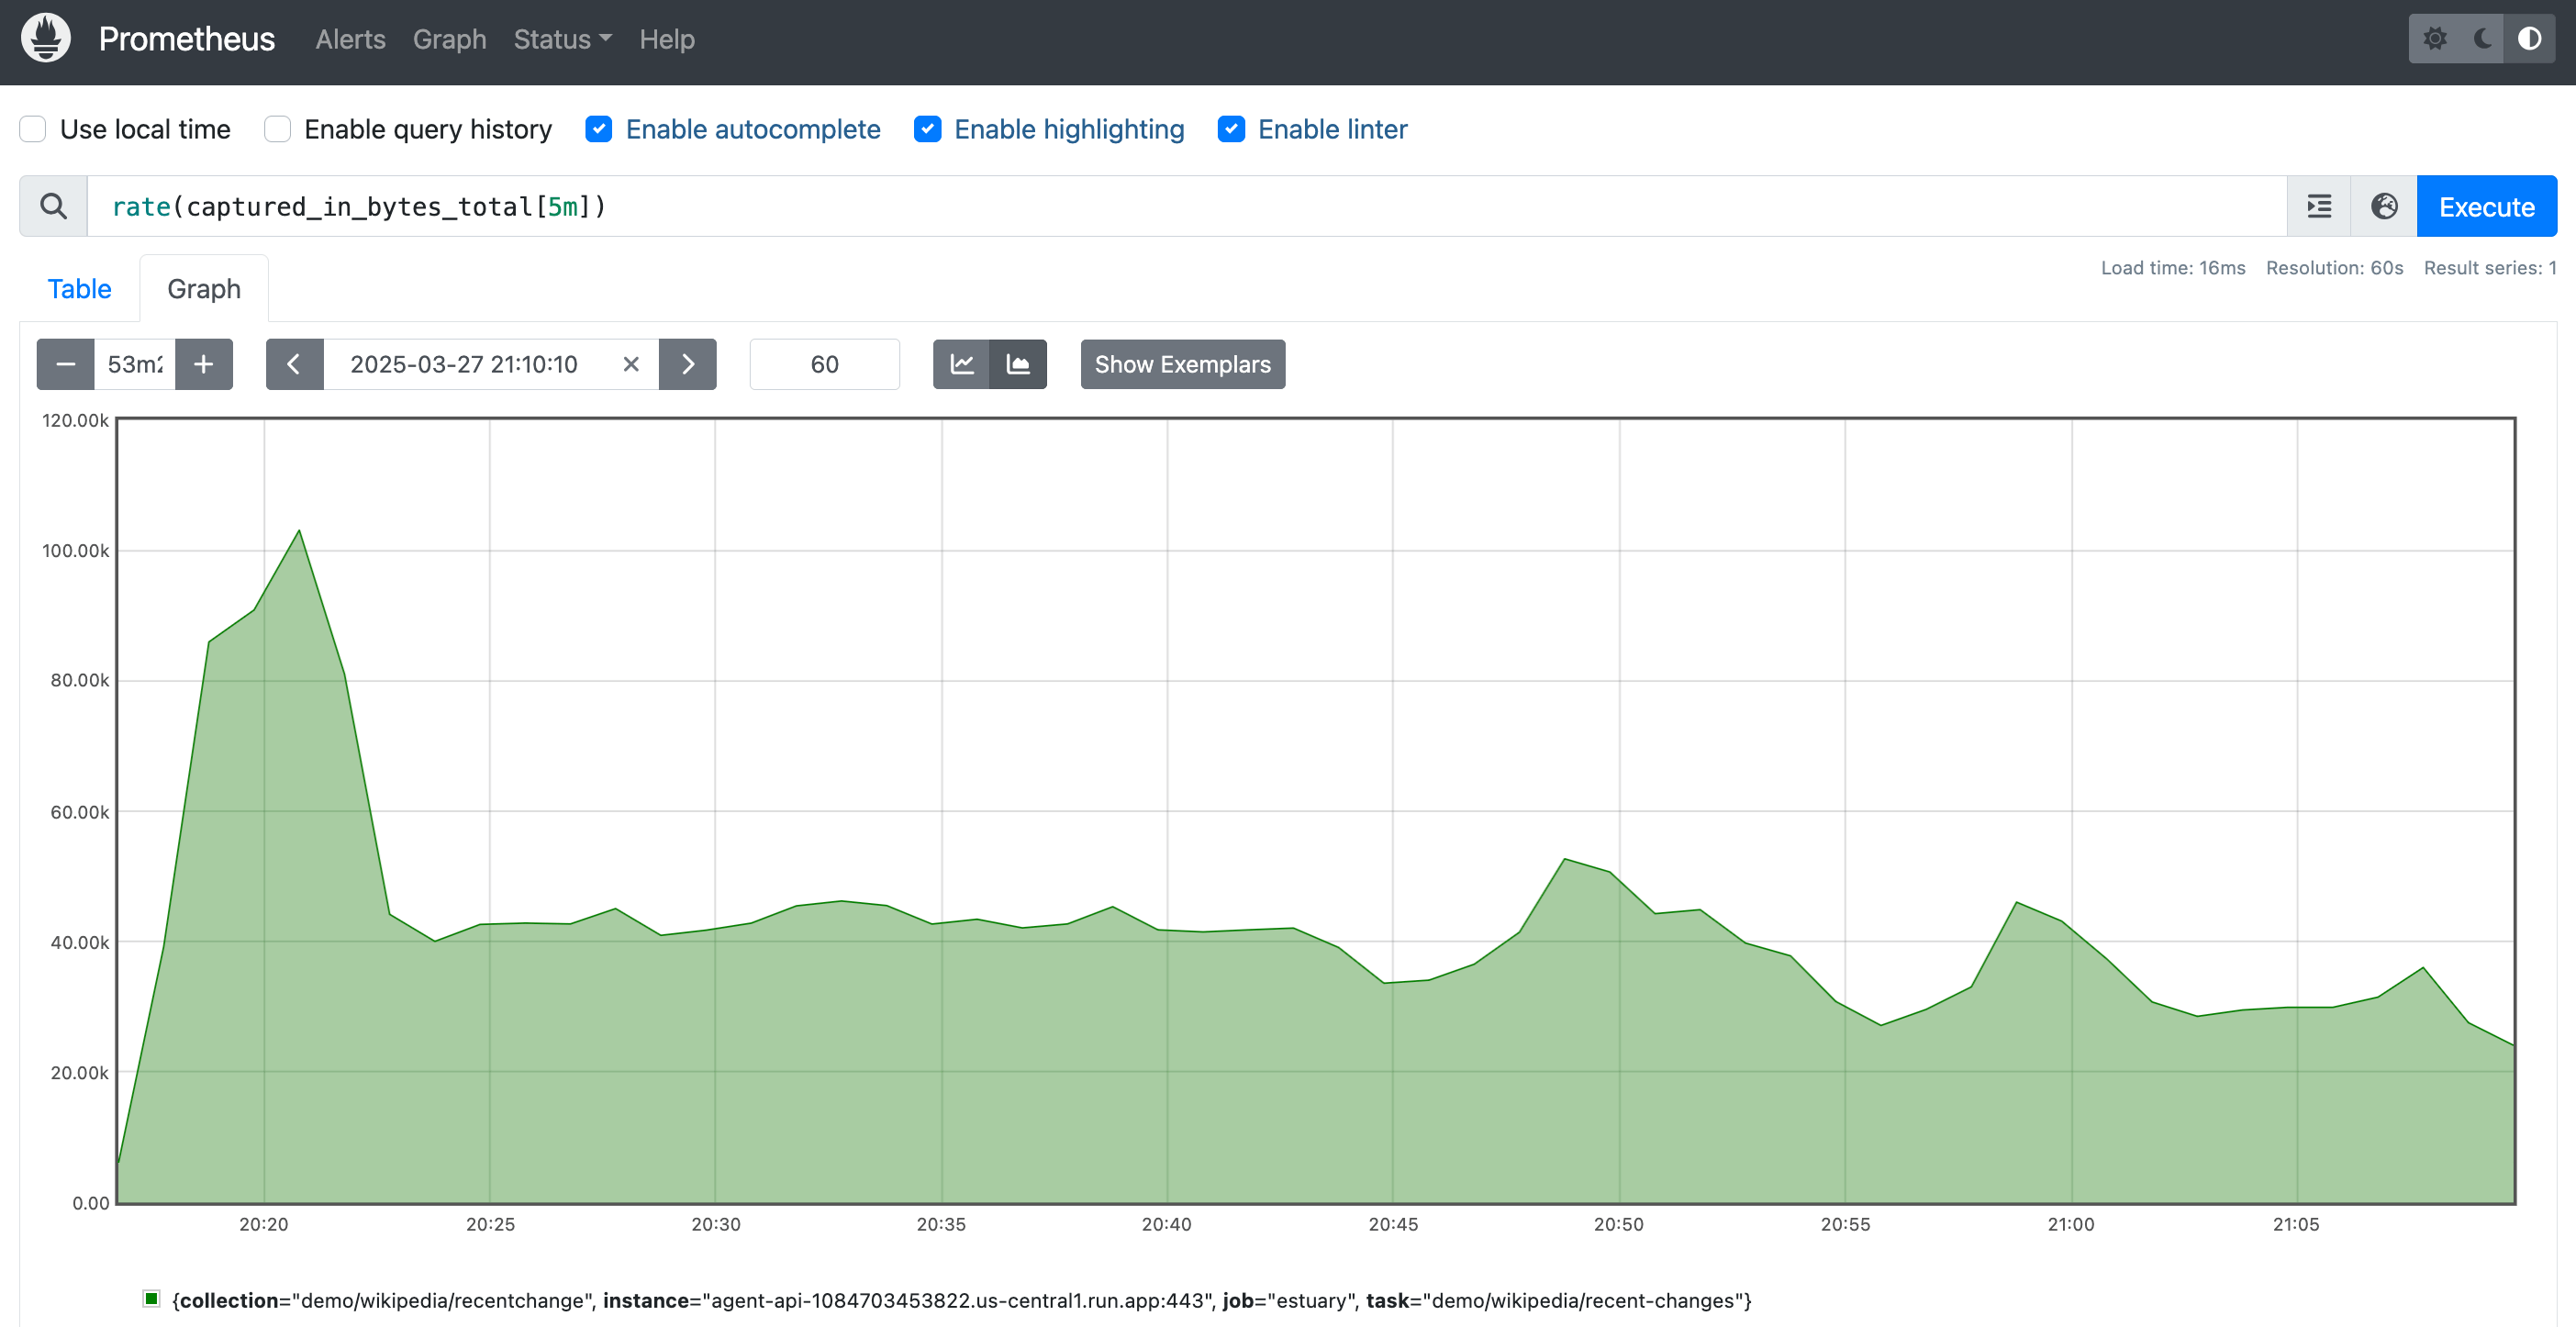
Estuary exposes internal pipeline metrics through a Prometheus-compatible OpenMetrics API, making it easy to plug pipeline observability into your existing Prometheus setup.
Key metrics you can track include:
- captured_in_docs_total: Documents ingested from a source system
- derived_out_docs_total: Documents output from in-stream transformations
- materialized_out_docs_total: Documents successfully written to downstream systems
- logged_errors_total: Error counts across pipeline tasks
- *_published_at_time_seconds: Timestamps of the latest processed records
Want setup details? See full Estuary Prometheus integration docs →
2. Datadog
Datadog is a popular cloud-native observability platform trusted by enterprises for full-stack monitoring—from infrastructure and applications to logs and real-time metrics. With its intuitive UI and powerful integrations, it’s especially valuable for teams managing complex systems at scale.
Why It Stands Out
- All-in-one platform: Combines metrics, traces, logs, and dashboards in one place
- Rich visualization: Real-time graphs, heatmaps, and anomaly detection powered by machine learning
- Wide integration library: Native support for over 600 technologies, including AWS, Kubernetes, and databases
- Flexible alerting: Customizable thresholds, composite alerts, and incident workflows
Real-Time Use Case
Datadog is ideal for monitoring cloud environments and distributed systems with heavy real-time workloads. Whether you're tracking latency spikes in Kafka consumers or alerting on transformation failures, Datadog makes it easy to respond quickly.
Estuary Integration
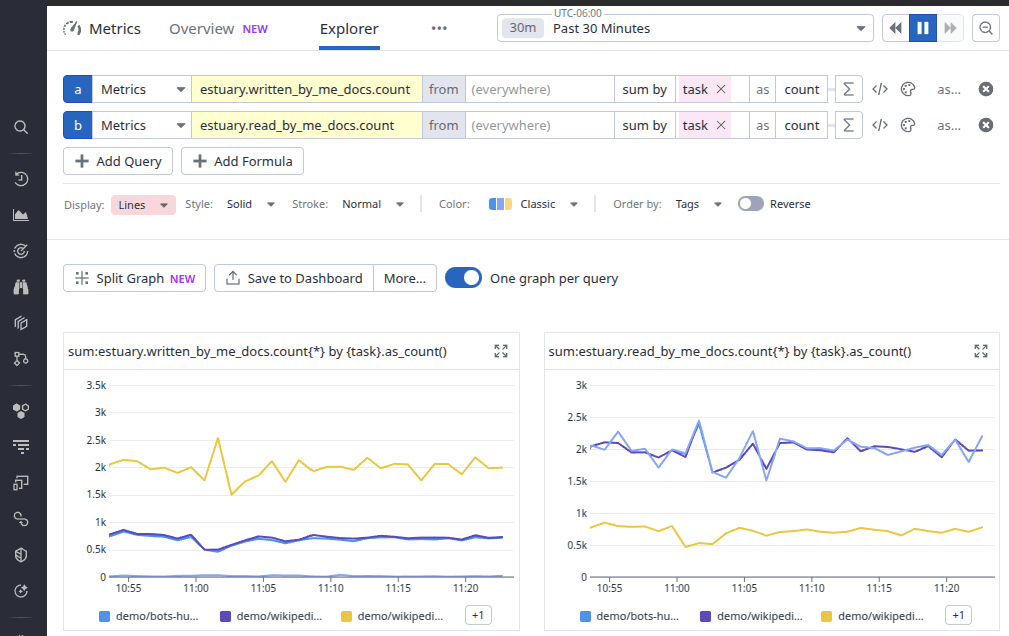
Estuary integrates seamlessly with Datadog via its OpenMetrics API. By configuring the Datadog Agent with the OpenMetrics check, you can ingest real-time pipeline metrics directly into your Datadog dashboards.
Metrics exposed include:
- captured_in_docs_total: Documents ingested from sources
- derived_out_docs_total: Documents produced from transformations
- materialized_out_docs_total: Records successfully written to targets
- logged_errors_total: Error count per task
With this setup, you gain end-to-end visibility, tying together infrastructure and pipeline health in one observability plane.
Full setup walkthrough available here: Estuary + Datadog OpenMetrics Guide →
3. Grafana
Grafana is the industry-standard open-source visualization tool for time-series data. While it doesn’t collect metrics on its own, it shines as a flexible dashboard and alerting layer on top of observability data sources like Prometheus, InfluxDB, Loki, and more.
Why It Stands Out
- Rich visualizations: Supports graphs, heatmaps, histograms, gauges, and more
- Wide data source support: Integrates with over 100 backends including Prometheus, Elasticsearch, PostgreSQL, and Loki
- Custom dashboards: Tailor your views by pipeline, service, region, or team
- Built-in alerting: Trigger alerts via Slack, PagerDuty, email, and more
Real-Time Use Case
Grafana is ideal for visualizing metrics from streaming data pipelines. Whether you're tracking throughput, lag, error rates, or system load, Grafana helps surface patterns and anomalies quickly, especially when paired with Prometheus or Datadog.
Estuary Compatibility
Estuary doesn’t integrate with Grafana directly, but it works seamlessly via Prometheus. Once you expose pipeline metrics using Estuary’s OpenMetrics API and collect them with Prometheus, Grafana can visualize that data in real time.
Common Estuary metrics to chart include:
- *_docs_total (capture, transform, and materialization throughput)
- logged_errors_total (error trends by task or connector)
- *_published_at_time_seconds (freshness of the most recent data point)
With Grafana + Prometheus + Estuary, you get a complete picture of:
- Infrastructure health
- Data pipeline performance
- Streaming lag and failure trends
4. Elastic Observability (ELK Stack)
Elastic Observability builds on the ELK Stack—Elasticsearch, Logstash, and Kibana—to offer a unified solution for logs, metrics, and APM. It's a go-to choice for teams that need deep search capabilities across large volumes of observability data.
Why It Stands Out
- Log-first design: Ideal for capturing, indexing, and querying structured and unstructured logs
- Full-stack visibility: Correlate logs, metrics, and traces from multiple layers of your architecture
- Scalable performance: Elasticsearch powers fast queries at scale
- Custom dashboards: Kibana lets you build visualizations and alerts on any ingested data
Real-Time Use Case
Elastic is especially useful for tracking pipeline execution logs, transformation warnings, and resource bottlenecks in microservices or streaming systems. Teams that rely on log-driven observability will benefit from its powerful search and aggregation features.
Estuary Compatibility
Estuary does not offer native integration with Elastic Observability, but you can still forward metrics using Prometheus as an intermediary.
Here’s how:
- Use the Prometheus module in Metricbeat, or
- Set up an OpenTelemetry Collector to scrape Estuary’s OpenMetrics endpoint and forward it to Elasticsearch
This enables you to visualize key metrics like:
- logged_errors_total: Track errors by task for alerting and debugging
- *_docs_total: Monitor record volume across captures and materializations
- *_published_at_time_seconds: Measure how fresh your streamed data is
Tip: Use Metricbeat’s Prometheus module to bridge Estuary metrics into Elastic dashboards
With this approach, Elastic becomes a powerful log-and-metrics observability layer for both infrastructure and real-time data pipelines.
5. OpenTelemetry
OpenTelemetry (OTel) is an open-source observability framework for generating, collecting, and exporting telemetry data—traces, metrics, and logs—in a standardized way. It's a vendor-neutral project under the Cloud Native Computing Foundation (CNCF), designed to unify instrumentation across the stack.
Why It Stands Out
- Unified instrumentation: Single SDK and API for metrics, logs, and traces
- Standard formats: Makes it easy to send data to systems like Prometheus, Jaeger, or Elasticsearch
- Growing ecosystem: Actively maintained and supported by most major observability vendors
- Custom pipeline control: Exporters, processors, and collectors let you shape telemetry flow as needed
Real-Time Use Case
OpenTelemetry is perfect for engineering teams building custom observability pipelines. It provides flexible instrumentation for streaming platforms, real-time applications, and microservices, without locking you into a single tool.
You can deploy collectors to standardize telemetry across a hybrid environment, then send it to a backend of your choice (e.g., Prometheus for metrics, Jaeger for traces).
Estuary Compatibility
Estuary exposes metrics in OpenMetrics format, which is compatible with Prometheus and can be integrated into OpenTelemetry pipelines via the Prometheus receiver in the OTel Collector.
How it works:
- Deploy an OpenTelemetry Collector
- Use the Prometheus receiver to scrape Estuary’s OpenMetrics endpoint
- Forward metrics to your preferred backend (Elastic, Datadog, OTLP, etc.)
This approach gives you flexibility to:
- Centralize Estuary metrics alongside app and infra data
- Send observability signals to multiple tools in parallel
- Normalize metrics for unified analysis and alerting
Example: OpenTelemetry Collector Prometheus Receiver →
Using OpenTelemetry with Estuary helps platform teams create custom, scalable observability pipelines that meet compliance and architectural needs.
Observing the Pipeline with Estuary
All of the observability tools above do an excellent job of showing you what’s happening on your infrastructure, but they don’t always show you what’s happening with your data.
If you’re working with streaming pipelines, change data capture (CDC), or real-time analytics workflows, there’s a crucial gap between what gets monitored and what truly matters: Is the data flowing correctly? Is it fresh, accurate, and error-free?
That’s where Estuary’s OpenMetrics API comes in.
What Estuary Adds to Your Observability Stack
Estuary is a real-time data integration platform built for streaming-first architecture. Its OpenMetrics API exposes task-level metrics for:
- Captures: Ingestion from sources like PostgreSQL, Kafka, or MongoDB
- Derivations: On-the-fly transformations applied mid-stream
- Materializations: Deliveries to destinations like BigQuery, Snowflake, Iceberg, or Databricks
These metrics are exposed in Prometheus-compatible format, making it simple to integrate with tools you already use, such as Prometheus, Datadog, and OpenTelemetry collectors.
Metrics You Can Monitor
With Estuary’s observability layer, you can track:
- captured_in_docs_total: Records pulled from source systems
- derived_out_docs_total: Records transformed by Flow tasks
- materialized_out_docs_total: Records delivered to downstream systems
- logged_errors_total: Task-level error counts
- *_published_at_time_seconds: Freshness of last processed document
These are not synthetic application metrics—they are real, actionable insights from deep inside your pipeline, exposed automatically and continuously.
Works Seamlessly With Your Existing Tools
Estuary doesn’t require a new dashboard or monitoring UI. You can simply point:
- Prometheus to Estuary’s /metrics endpoint
- Datadog to Estuary’s OpenMetrics API
- OpenTelemetry collectors to scrape and route metrics wherever you want
No custom instrumentation required. Just set your tenant prefix, generate a token, and plug in.
Why This Matters
Observability shouldn’t stop at servers and services. In real-time systems, data is the product, and you need to know it’s flowing correctly.
By layering Estuary’s pipeline metrics into your observability stack, you get:
- End-to-end visibility across infrastructure and data
- Proactive alerting on data issues, not just crashes
- Deeper insights into performance, lag, and cost
It’s observability for what matters most: your data.
Conclusion: Observability Tools That Go Beyond Infrastructure
Choosing the right observability tools is essential for ensuring the reliability, performance, and clarity of modern systems, especially those powered by real-time data.
Tools like Prometheus, Datadog, Grafana, Elastic, and OpenTelemetry provide deep insights into infrastructure and application behavior. But to truly understand what’s happening across your streaming pipelines, you need observability that reaches inside the data flow itself.
That’s where Estuary bridges the gap. With its OpenMetrics API, you gain visibility into how data moves, transforms, and lands—complementing your existing tools without adding overhead.
Observability isn't just about uptime anymore. It's about data integrity, pipeline health, and trust.
Ready to see what your data pipelines are really doing? Try Estuary for real-time observability →

About the author
Emily is a software engineer and technical content creator with an interest in developer education. She has experience across Developer Relations roles from her FinTech background and is always learning something new.

