Real-time systems demand more than just speed; they require clarity. When your pipelines constantly stream critical business data, you must see what’s happening at every step. That’s where observability comes into play.
Estuary, a real-time data integration platform, now offers a powerful way to monitor your pipelines using the OpenMetrics API. Whether you're running captures from a database, transforming data midstream, or materializing outputs to an analytics engine, Estuary provides detailed insight into every task—out of the box.
This article walks you through using the OpenMetrics API, tracking what you can, and connecting it with tools like Prometheus and Datadog for full-stack observability.
Why Observability Is Critical for Real-Time Systems
In traditional batch processing, delays or errors may go unnoticed for hours. However, a single missed record or late transformation can cascade into downstream failures in real-time systems. That’s why observability isn’t just nice to have—it’s essential.
With proper monitoring, you can:
- Detect and resolve issues early
- Understand the behavior of each task
- Maintain SLAs and compliance
- Reduce costs by identifying inefficient patterns
Estuary’s OpenMetrics API is designed to meet these needs with a standards-based, detailed, and highly integrable metrics interface.
Overview of the OpenMetrics API
Estuary's OpenMetrics API is the heart of this observability layer. It exposes real-time metrics from your captures, derivations, and materializations in a Prometheus-compatible format.
API Endpoint:
https://agent-api-1084703453822.us-central1.run.app/api/v1/metrics/{prefix}/
Include the trailing slash (/) at the end of your tenant prefix or subpath.
To access the API, generate a refresh token from your Estuary dashboard and pass it as a Bearer token in your request header.
Real-Time Metrics You Can Track
The API provides counters (accumulating over time) and gauges (reflecting current state). Here are just a few examples:
Metric | Type | Description |
| captured_in_docs_total | Counter | Documents ingested before processing |
| derived_out_docs_total | Counter | Documents produced by transformations |
| materialized_out_docs_total | Counter | Documents written to the destination |
| logged_errors_total | Counter | Errors logged by any task |
| *_published_at_time_seconds | Gauge | The timestamp of the latest record processed |
These metrics are tagged by task, collection, and sometimes transform, making them highly precise for monitoring and alerting.
Setting Up Prometheus for Estuary Monitoring
Prometheus is a leading open-source monitoring system. To integrate it with Estuary, update your prometheus.yml like so:
plaintextglobal:
  scrape_interval: 1m

scrape_configs:
  - job_name: estuary
    scheme: https
    bearer_token: REFRESH_TOKEN
    metrics_path: /api/v1/metrics/PREFIX/
    static_configs:
      - targets: [agent-api-1084703453822.us-central1.run.app]
Replace REFRESH_TOKEN and PREFIX with your actual credentials. You can test this setup using Docker:
plaintextdocker run --rm -it -p 9090:9090 \
  -v $(pwd)/prometheus.yml:/etc/prometheus/prometheus.yml \
  prom/prometheus:latest
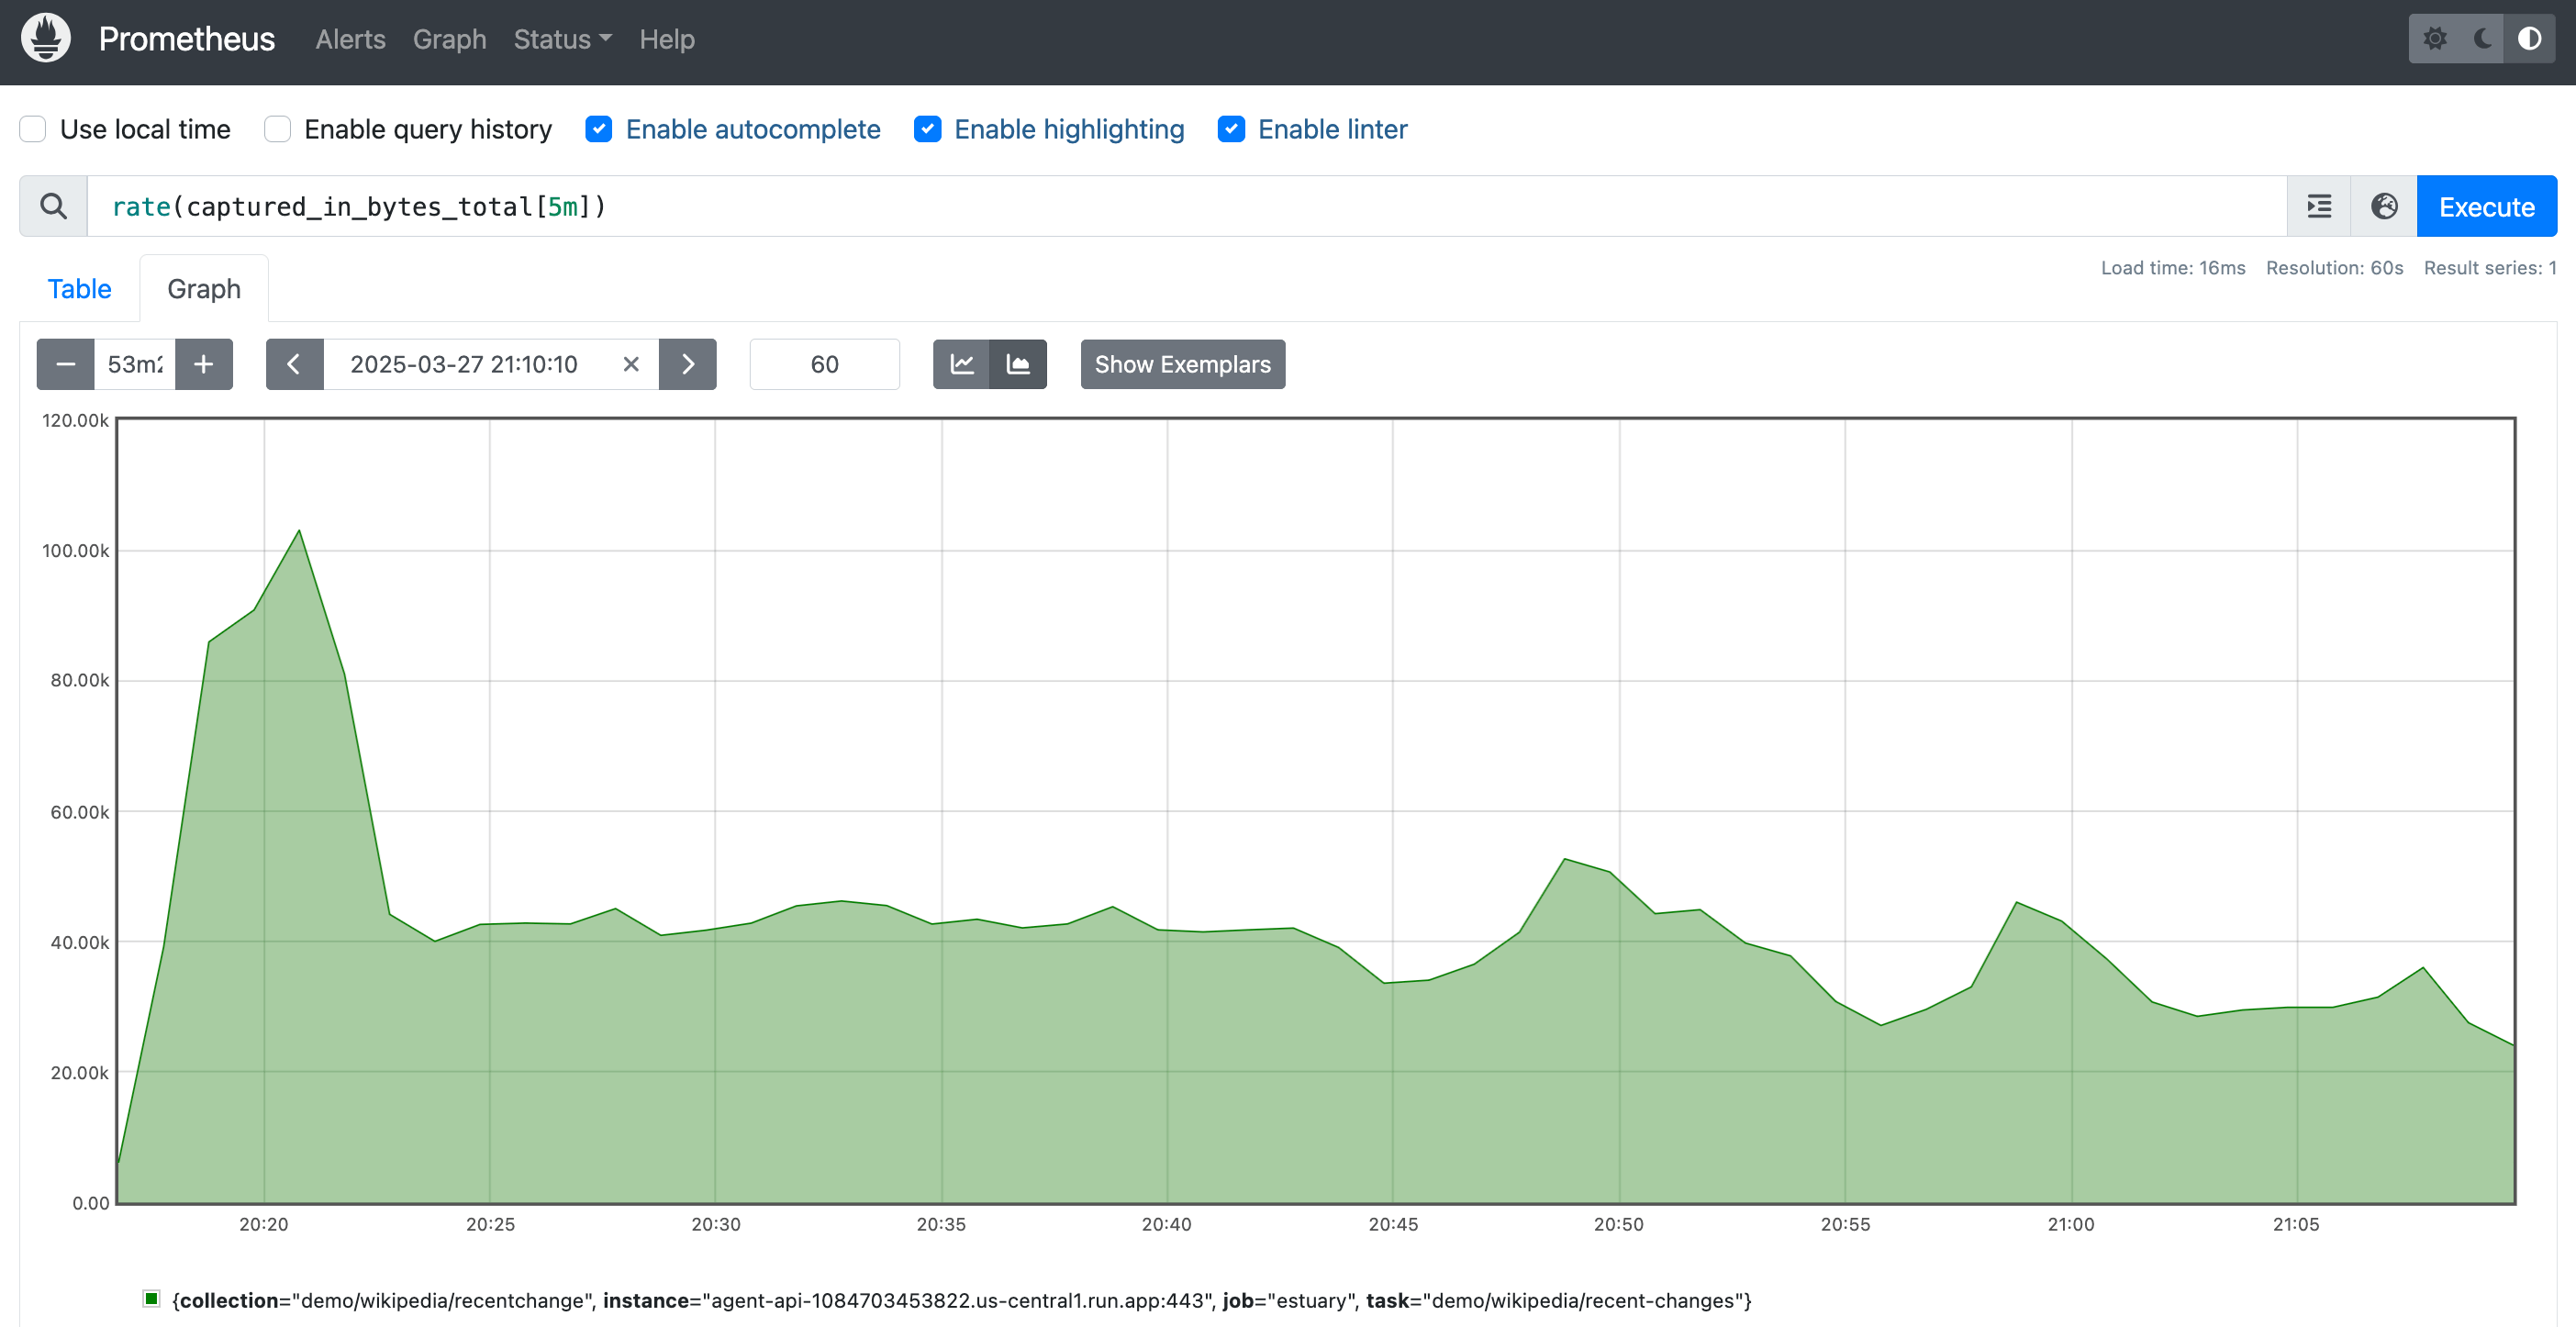
Once it’s running, visit http://localhost:9090 to explore your metrics and create dashboards that visualize the data flow through your system.
Integrating Estuary Metrics into Datadog
If your team uses Datadog, the OpenMetrics API can easily be added to your agent configuration. Here's a sample setup in datadog.yaml:
plaintextinstances:
  - openmetrics_endpoint: https://agent-api-1084703453822.us-central1.run.app/api/v1/metrics/PREFIX/
    namespace: estuary
    min_collection_interval: 60
    headers:
      Authorization: Bearer REFRESH_TOKEN
    metrics:
      - ".*"
To run the Datadog agent in Docker:
plaintextdocker run --rm -it \
  -v $(pwd)/datadog.yaml:/etc/datadog-agent/conf.d/openmetrics.d/conf.yaml:ro \
  -e DD_API_KEY=YOUR_DATADOG_API_KEY \
  -e DD_SITE=YOUR_DATADOG_SITE \
  -e DD_HOSTNAME=YOUR_HOSTNAME \
  -p 9090:9090 \
  gcr.io/datadoghq/agent:latest
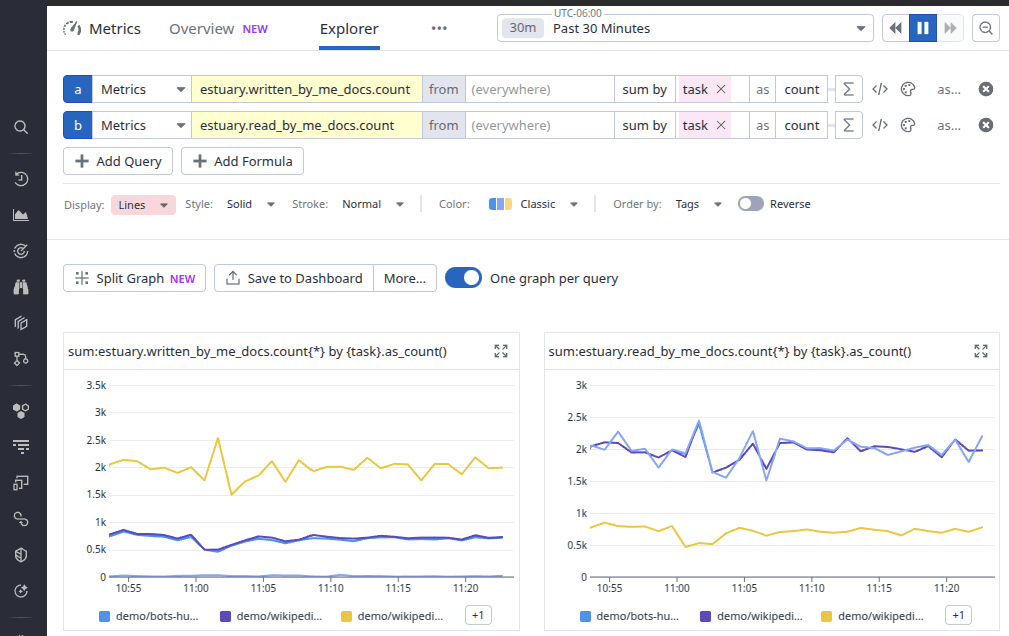
You’ll then be able to create visualizations, alerts, and incident workflows based on Estuary activity like you track infrastructure metrics.
Building Custom Monitoring Workflows
If you prefer a custom monitoring solution, the OpenMetrics API works with any system that can read standard Prometheus formats. A simple curl command is all it takes:
plaintextcurl --location 'https://agent-api.../metrics/PREFIX/' \
  --header 'Authorization: Bearer REFRESH_TOKEN'
The response includes metrics grouped by task and collection. For example:
plaintext# HELP logged_warnings_total Total WARN-level logs
# TYPE logged_warnings_total counter
logged_warnings_total{task="source-oracle"} 12
You can ingest these metrics into custom dashboards or alerting tools, giving you total control over monitoring your pipelines.
Best Practices for Observing Estuary Pipelines
Here are some guidelines to get the most out of your metrics:
- Use a 1-minute scrape interval to capture timely data without overwhelming your system.
- Tag metrics by task and collection for precision monitoring.
- Set alerts on error counts, failure logs, and data lag, especially for production pipelines.
- Track throughput trends using *_docs_total and *_bytes_total counters.
- Audit usage using usage_seconds_total for cost optimization and capacity planning.
Bringing It All Together
The OpenMetrics API unlocks complete visibility into Estuary pipelines. Whether ingesting data from Kafka, applying transformations on the fly, or materializing into modern table formats like Apache Iceberg, you can now observe and measure every detail in real-time.
The API ensures that observability scales with your system, with integration support for Prometheus and Datadog and full access to custom solutions.
Start Observing Your Flow
Observability transforms how engineering teams work. Instead of reacting to problems, you gain the tools to predict, prevent, and optimize. Estuary’s OpenMetrics API makes that possible for streaming data.
📖 Read the complete OpenMetrics documentation

About the author
Emily is a software engineer and technical content creator with an interest in developer education. She has experience across Developer Relations roles from her FinTech background and is always learning something new.
