Key Takeaways
- Time series data is structured around timestamps and is essential for real time monitoring and forecasting.
- Key components include trend, seasonality, noise, and structural breaks.
- Challenges such as irregular timestamps, missing data, and latency require proactive engineering solutions.
- Feature engineering techniques like lag variables and rolling statistics can greatly improve model performance.
- A well-designed pipeline includes ingestion, processing, storage, and visualization stages.
- Estuary Flow offers real time ingestion, transformation, and delivery to multiple destinations, making it a strong option for time series workloads.
Introduction
Imagine you are tasked with detecting anomalies in streaming sensor data or predicting trends in system performance. What do all these data stories have in common? They are built on time series data, the backbone of real-time intelligence and decision‑making.
What is time series data? It is a sequence of observations collected or recorded at specific points in time, often in chronological order. Unlike static, unordered datasets, time series data captures how information evolves, enabling deeper insights and predictive capabilities.
Why does this matter to data engineers? Because time series underpins critical applications such as monitoring web traffic, financial analytics, infrastructure health, IoT telemetry, and more. Your role is to build systems that ingest, process, store, and query these data streams with efficiency and reliability. Without a firm grasp of time series concepts, even the most performant systems can falter.
In this guide, you will explore:
- A clear definition and real-world relevance of time series data
- How it differs from other data formats
- The key technical challenges it presents for data engineering
By the end, you'll understand why mastering time series data isn’t just academic—it’s foundational to delivering performant, insight-driven pipelines that scale.
What is Time Series Data
Time series data is a collection of observations recorded over time in chronological order. Each entry in the dataset is tied to a specific timestamp, which makes time the central organizing element. These observations may be captured at regular intervals such as every second or hour, or at irregular intervals depending on when events occur.
Why is time series data important for data engineers?
Time series data is the foundation for many real-time analytics and monitoring systems. It is used to track stock prices in finance, measure sensor readings in industrial IoT, monitor server performance in technology infrastructure, and evaluate patient vitals in healthcare. For a data engineer, understanding the properties of time series data is essential to designing pipelines that can handle high volume, high velocity, and time dependent information.
How does time series data differ from other data types?
Unlike cross-sectional data, which represents a snapshot of multiple entities at one moment, time series data focuses on how a single entity or measurement changes over time. It is also different from panel data, which combines both time series and cross-sectional aspects. This focus on temporal progression enables forecasting, trend analysis, and anomaly detection that other data types cannot provide.
What makes time series data unique in engineering workflows?
Several factors set time series data apart when designing pipelines:
- Temporal ordering: The sequence of events matters, so maintaining timestamp accuracy is critical.
- Variable intervals: Data can be evenly spaced or event-driven, which affects storage and query strategies.
- Historical dependency: Many analytical models rely on past values to predict future outcomes.
Components of Time Series Data
Understanding the components of time series data is the first step toward accurate analysis and modeling. These components describe the patterns and variations present in the data, and each plays a role in how engineers design processing pipelines.
Trend
The trend represents the long-term movement in the data over an extended period. It can be upward, downward, or stable. For example, a gradual increase in monthly energy consumption over several years indicates a positive trend. Identifying trends helps in capacity planning and forecasting.
Seasonality
Seasonality refers to repeating patterns that occur at fixed intervals, such as hourly, daily, weekly, or yearly cycles. Examples include increased retail sales during holiday seasons or peak website traffic at specific hours of the day. Recognizing seasonality ensures models adjust for these predictable variations.
Noise or Irregular Variations
Noise consists of random, unpredictable fluctuations in the data. It can result from measurement errors, external disturbances, or one-off events. While noise cannot be eliminated completely, smoothing techniques and filtering can reduce its impact on analysis.
Structural Breaks
A structural break occurs when the underlying pattern of the data changes significantly, often due to external factors such as a policy change, market disruption, or system upgrade. Detecting structural breaks is important because they can invalidate previously reliable models.
Why should data engineers care about these components?
Knowing whether data contains strong seasonal effects, noticeable trends, or irregular changes helps engineers select the right storage strategies, query optimizations, and modeling approaches. For instance, high seasonality may require storing more granular data for accurate future predictions.
Challenges in Working with Time Series Data
Time series data offers valuable insights, but it also presents unique challenges that require careful consideration in engineering workflows. Ignoring these challenges can lead to inaccurate analytics, poor performance, or unstable pipelines.
Irregular Timestamps
Not all time series data arrives at consistent intervals. Sensor failures, network delays, or event driven systems can cause gaps or uneven spacing between records. Data engineers need to decide whether to interpolate missing timestamps or adjust the model to handle irregularity.
Missing or Incomplete Data
Data loss can occur due to connectivity issues, logging failures, or upstream processing errors. Missing values must be addressed with imputation, filtering, or model adjustments to prevent skewed results.
Data Drift
Over time, the characteristics of the data may change. This can happen gradually, such as evolving customer behavior, or suddenly after a system change. Drift can reduce the accuracy of predictive models and requires ongoing monitoring.
Ordering and Latency in Streaming Systems
In real-time pipelines, events can arrive out of sequence or with significant delays. Maintaining proper event ordering and managing latency is critical to preserve analytical accuracy.
Storage and Query Performance at Scale
High-frequency time series data can grow rapidly, leading to storage bottlenecks and slow queries. Engineers must choose storage solutions optimized for time-based indexing, partitioning, and efficient data retention policies.
Why addressing these challenges is essential
Failing to address these issues can result in unreliable insights, slow performance, or even system failures. Designing robust pipelines means accounting for each challenge from the start, rather than trying to fix problems after they arise.
Time Series Data Pipelines: From Ingestion to Insights
A time series data pipeline is the end-to-end process that collects, processes, stores, and delivers time-indexed information for analysis. For data engineers, designing this pipeline efficiently is crucial to ensure low latency, high accuracy, and scalability.
Data Ingestion
The first step is acquiring data from its source. This can include database change data capture (CDC), IoT devices, log files, or streaming APIs. Technologies such as Apache Kafka, MQTT brokers, and managed streaming platforms are often used to handle high volume and velocity.
Data Processing
Once ingested, time series data often needs transformation before it can be stored or analyzed. This can involve filtering noise, aggregating data over specific intervals, or enriching records with external context. Real-time processing frameworks like Apache Flink or Apache Beam can handle these operations at scale.
Data Storage
The choice of storage system depends on data volume, query requirements, and retention needs. Common options include time series databases like InfluxDB and TimescaleDB, analytics stores such as ClickHouse, or data warehouses like BigQuery and Snowflake. Proper partitioning and indexing strategies are essential for efficient retrieval.
Visualization and Insights
After storage, the data is made available for analysis and visualization. Tools such as Grafana, Apache Superset, or custom dashboards can present trends, detect anomalies, and provide actionable insights in real time.
Designing for Reliability
A robust pipeline includes error handling, monitoring, and alerting to ensure data quality and system stability. This involves implementing retries for ingestion failures, schema validation, and latency tracking.
Feature Engineering for Time Series
Feature engineering transforms raw time series data into a format that improves the performance of analytical models. For data engineers, this step is essential because many machine learning algorithms rely on well-prepared inputs to deliver accurate forecasts and anomaly detection.
Lag Features
Lag features are previous values in the series used as predictors for future observations. For example, predicting tomorrow’s temperature might involve using the temperatures from the last three days. These features help models capture autocorrelation patterns.
Rolling Statistics
Rolling or moving windows calculate statistics over a specified number of past observations. Common metrics include moving averages, rolling sums, or rolling standard deviations. Rolling features smooth out short-term fluctuations and highlight longer-term patterns.
Time-Based Features
Time-based features use the timestamp to create new variables such as day of the week, month, holiday indicators, or business hours. These features are useful when there are seasonal or cyclical patterns in the data.
Differencing
Differencing calculates the change between consecutive observations. This technique can help make a non-stationary series more stable by removing trends or seasonal effects.
Frequency Domain Features
Some applications benefit from transforming the time series into the frequency domain using Fourier transforms or wavelet analysis. These features help identify periodic components that may not be obvious in the time domain.
Why it matters
Well-crafted features can significantly improve the accuracy of forecasting and anomaly detection models. Engineers who automate this process in their pipelines can achieve more consistent and scalable results.
Modeling Techniques for Time Series
Once time series data has been cleaned and transformed, the next step is selecting an appropriate modeling approach. The choice of model depends on the data characteristics, the goal of the analysis, and the resources available for computation.
Autoregressive (AR) Models
Autoregressive models predict future values based on a linear combination of past values. They are effective when the current observation depends heavily on its immediate history.
Moving Average (MA) Models
Moving average models use past forecast errors to predict future values. This approach works well when noise patterns are correlated over time.
ARMA and ARIMA Models
ARMA models combine autoregressive and moving average components, while ARIMA adds an integration step to handle non-stationary data. ARIMA is one of the most common statistical methods for forecasting and is widely supported in analytics libraries.
Seasonal ARIMA (SARIMA)
SARIMA extends ARIMA by modeling seasonal effects explicitly. This is useful for data with recurring patterns, such as sales spikes during holiday periods or energy usage that peaks in certain months.
Vector Autoregression (VAR)
VAR models are designed for multivariate time series where multiple variables influence each other over time. This is particularly relevant when analyzing interconnected metrics, such as website traffic and ad spend.
Machine Learning and Deep Learning Methods
Advanced techniques include gradient boosting models, recurrent neural networks (RNNs), and long short-term memory networks (LSTMs). These methods can capture complex, non-linear relationships in large datasets but require more computation and careful tuning.
Selecting the right model
The best model balances accuracy, interpretability, and performance. Data engineers often evaluate multiple models and choose the one that performs best against validation data while meeting latency and scalability requirements.
Best Practices for Engineers
Designing and managing time series data pipelines requires more than just technical knowledge of storage systems and processing frameworks. Following proven best practices ensures that pipelines remain reliable, scalable, and ready for analytical workloads.
Ensure Data Quality from the Start
Validate incoming data for correct timestamp formats, missing values, and out-of-order records. Catching issues at ingestion is far easier than correcting them after storage.
Automate Feature Pipelines
Implement automated workflows for creating lag features, rolling statistics, and time-based variables. Automation ensures consistency across datasets and reduces manual processing time.
Monitor for Latency and Completeness
Set up continuous monitoring to track how quickly data flows through the pipeline and whether any expected data is missing. Alerting mechanisms should notify engineers of any anomalies.
Handle Schema Evolution
Time series pipelines often evolve as new fields are added or existing structures change. Using schema enforcement and versioning strategies prevents downstream breakage.
Optimize Storage and Query Performance
Choose a storage solution with native support for time-based indexing and partitioning. Apply retention policies to remove stale data while keeping the most relevant history for analysis.
Plan for Scalability
Build pipelines that can handle growth in data volume and velocity. This includes selecting horizontally scalable systems, using efficient serialization formats, and avoiding single points of failure.
Test and Validate Regularly
Regularly test pipeline components with both historical and synthetic data. This ensures models and processes continue to perform accurately as conditions change.
Building a Time Series Pipeline with Estuary Flow
While there are many ways to manage time series data pipelines, using a real time data movement platform can reduce complexity and improve reliability. Estuary Flow is one such platform that enables engineers to capture, transform, and deliver time series data with minimal operational overhead.
Example Scenario:
Consider a manufacturing company that wants to monitor equipment performance in real time. IoT sensors stream temperature, vibration, and pressure readings every second. These readings need to be ingested, processed for anomalies, and stored in a time series database for visualization and historical analysis.
How Estuary Flow Fits In
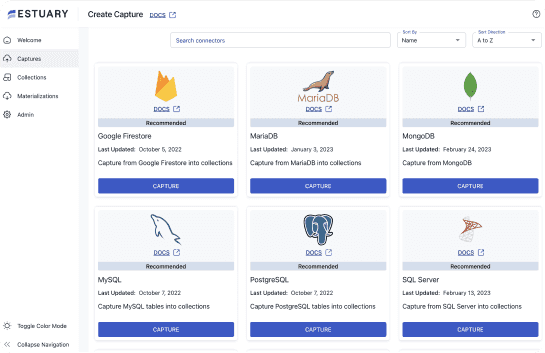
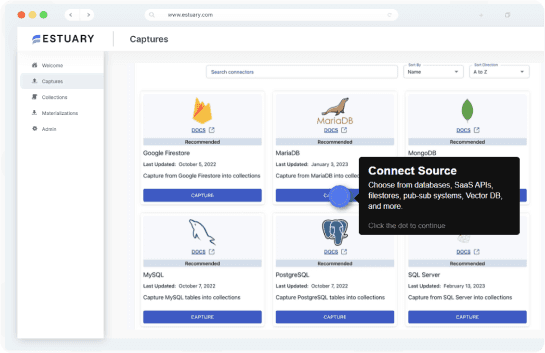
- Capture from Multiple Sources
Flow supports connectors for databases, APIs, and streaming systems, allowing you to bring in time series data from multiple sensors or applications without writing custom ingestion code. - Process in Real Time
Transformations such as aggregation, enrichment, or filtering can be applied directly within Flow. This means engineers can prepare the data for downstream use without additional processing layers. - Materialize to Destinations
Data can be delivered to time series databases like TimescaleDB or analytics platforms like ClickHouse and BigQuery. Materializations are continuous, ensuring data is available for querying and visualization almost instantly. - Maintain Data Integrity
Exactly-once delivery and schema enforcement help ensure the pipeline remains consistent, even under high-volume or high-frequency conditions.
Benefits for Time Series Workloads
- Real time ingestion without complex broker setups
- Built in schema validation to prevent downstream issues
- Ability to integrate with both OLAP warehouses and specialized time series stores
- Reduced operational maintenance compared to DIY streaming architectures
By using Estuary Flow, engineers can focus more on analysis and modeling rather than managing infrastructure and custom code for ingestion.
Summary
Time series data is the foundation for many real time analytics, forecasting models, and monitoring systems. It provides a chronological view of how values change over time, enabling engineers and analysts to detect trends, identify anomalies, and make informed decisions. Working effectively with time series requires understanding its components, addressing engineering challenges, and designing robust pipelines that can scale.
Platforms like Estuary Flow can simplify the process of capturing, transforming, and delivering time series data to destinations where it can be stored and analyzed. While the principles of time series engineering apply across many tools, using a platform that handles real time ingestion and schema management can accelerate project timelines and improve reliability.
FAQs
What are the main components of time series data?
How is time series data different from regular data?
What is time series data analysis?
How can Estuary Flow help with time series data pipelines?

About the author
Team Estuary is a group of engineers, product experts, and data strategists building the future of real-time and batch data integration. We write to share technical insights, industry trends, and practical guides.


