Change Data Capture (CDC) with Debezium can unlock real-time data flows from your operational databases – but running Debezium in production is far from a “set it and forget it” experience. Data engineers often encounter significant challenges when deploying Debezium at scale.
In this post, we dive into the real-world pain points of using Debezium for CDC, focusing on operational overhead, technical limitations, connector-specific pitfalls, error handling struggles, and some non-obvious failure modes that surface in production. This technical exploration highlights Debezium’s drawbacks so you can know what to watch out for in a production CDC pipeline.
Operational Overhead with Debezium
Running Debezium in production introduces considerable operational complexity. Debezium is typically deployed via Apache Kafka Connect and often involves running a Kafka cluster (along with ZooKeeper, in many cases) as the backbone for event streaming. For organizations not already using Kafka, this adds a heavy infrastructure burden – you must stand up and maintain a Kafka ecosystem just to support CDC streaming. Even if Kafka is part of your stack, the additional load of CDC data means continuous monitoring and tuning of Kafka itself (managing topics, partitions, retention, throughput, etc.) is necessary.
Key aspects of Debezium’s operational overhead include:
- Complex Infrastructure Dependencies: Deploying Debezium is not just running a single service – you need Kafka brokers, Kafka Connect workers, and (until recently) ZooKeeper to coordinate. This distributed stack requires specialized expertise in Kafka and Java to manage and troubleshoot. Teams must be proficient in Kafka Connect configuration and understand Kafka internals to ensure smooth CDC pipelines.
- Resource Intensive at Scale: A high-volume CDC pipeline can consume significant CPU, memory, and network resources. It often takes continuous DevOps effort to tune and provision enough resources so Debezium doesn’t get throttled when the change event volume spikes. If the pipeline lags and Kafka topic retention isn’t long enough to buffer the backlog, you risk data loss when the old CDC events age out. Teams must closely watch metrics and scale connector tasks or Kafka cluster capacity to keep up with peak loads.
- Monitoring and Lag Management: Operating Debezium means setting up extensive monitoring. Debezium emits JMX metrics out of the box, but you’ll need to scrape and visualize them (e.g., via Prometheus and Grafana) to get insight into lag and throughput. Debezium’s “MilliSecondsBehindSource” is a crucial metric, indicating CDC lag in milliseconds. If this lag grows continuously, Debezium will fall behind in reading the database’s change log. Engineers often must build custom dashboards/alerts on such metrics to catch problems early. In short, robust observability is not built-in – you must create it.
- No Auto-Scaling or Quick Recovery: Debezium runs connectors as Kafka Connect tasks, which are generally single-threaded per table/partition. There’s no built-in auto-scaling to handle sudden load increases. Spinning up additional connectors or tasks to handle more load is manual and not instantaneous – there is no concept of a hot standby connector ready to take over. If a connector fails, Kafka Connect won’t restart it automatically in some cases; it may require manual intervention after the underlying issue is fixed. This operational rigidity means teams must be on-call to adjust or restart Debezium connectors when things go awry.
- Maintenance and Upgrades: Debezium requires you to keep up with updates and bug fixes as an open-source tool. You’ll need a process to upgrade Debezium and Kafka Connect versions to pick up critical fixes, which involves testing to ensure the new versions don’t break your pipeline. Security patches and Java library updates are also your responsibility. In a containerized environment, that means keeping Docker images updated and configurations compatible across a possibly large deployment.. This ongoing maintenance can consume engineering time that would otherwise go to developing data features.
In practice: Shippit, an Australian logistics platform, ran Debezium + Kafka for CDC but found the operational complexity unsustainable as their data team scaled. Managing connectors, schema changes, and infrastructure maintenance pulled engineering focus away from delivering value. They replaced their entire Debezium + Kafka stack with Estuary, reducing costs by 45% and eliminating the operational overhead. Read the full story →
It’s telling that companies operating Debezium at a very large scale often dedicate multiple engineers solely to maintaining these CDC pipelines. Reports indicate that organizations like Netflix or Robinhood have 4–6 full-time engineers babysitting Debezium in production for high-volume use cases. The bottom line: Debezium's operational overhead is non-trivial—from infrastructure setup to continuous tuning and monitoring, running Debezium reliably requires significant engineering investment.
Real-world example: Connect&GO, which manages visitor data pipelines for 12+ MySQL databases serving attractions and amusement parks, evaluated Kafka/Debezium but ruled it out due to complexity and resource strain on their lean data team. Their previous self-hosted batch ELT ran every 45 minutes — when clients demanded near-real-time data, adding Debezium would have made the maintenance burden even worse. They switched to Estuary and achieved 15-second latency (180x improvement) at 5x lower cost, without a Kafka cluster. Read the full story →
If you're looking for a solution with less infrastructure complexity, this detailed comparison of Debezium vs Estuary highlights how modern CDC platforms simplify operational overhead.
Technical Limitations of Debezium’s CDC Approach
Aside from infrastructure burdens, Debezium has technical limitations that can impact performance and flexibility in a CDC pipeline. These include throughput bottlenecks, challenges with schema evolution, lack of exactly-once delivery, and constrained transformation capabilities.
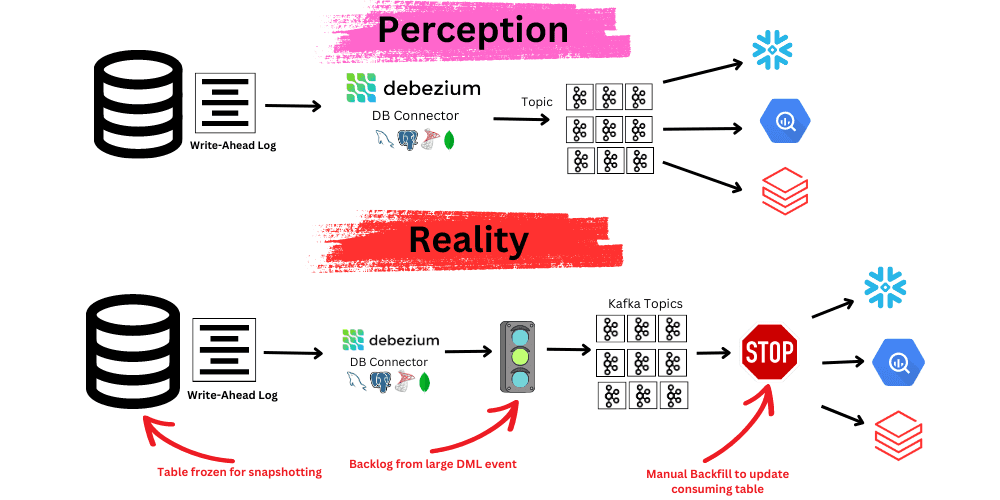
- Throughput Bottlenecks and Latency: Debezium's default design uses a single Kafka Connect task per connector, capturing change events in a single-threaded manner per database/table. This limits the processing capacity to about 7,000 events per second for the Postgres connector. If changes exceed this rate, Debezium will lag. You would need multiple connectors to scale, complicating data partitioning and reassembly. Significant transactions, such as batch updates, can clog the pipeline as Debezium processes every change, leading to increased latency for downstream consumers.
- Initial Snapshot Performance: When Debezium connects to a database, it takes a snapshot of the current data to establish a baseline. This snapshot is typically single-threaded and non-concurrent, resulting in long completion times for large tables and potentially impacting the source DB’s performance. Some connectors may lock tables or issue global read locks, affecting availability during the snapshot. While newer versions of Debezium offer incremental snapshots and configuration options to improve efficiency, initial syncs can still cause delays and load.
- At-Least-Once Delivery (Duplicates): Debezium (via Kafka) does not guarantee exactly-once delivery for change events, using at-least-once delivery semantics. This means duplicates can occur if a connector or Kafka Connect worker crashes after sending events before updating its offset. Debezium has no built-in de-duplication, so consumers must handle duplicates, often through primary key checks or UPSERT semantics. Achieving exactly-once CDC may require integration with other frameworks, leading many teams to implement custom deduplication for their consumers.
- Schema Evolution Challenges: Handling schema changes in a source database is challenging with CDC, and Debezium offers only partial automation. Simple changes, like adding a new column, are managed smoothly; Debezium will include it in change events shortly after. However, complex changes such as altering primary keys, renaming columns, or merging tables require manual intervention. The documentation advises stopping the connector, possibly putting the database in read-only mode, adjusting the configuration, and taking a new snapshot to prevent data inconsistencies, which incurs downtime. Additionally, some DDL changes in Postgres, like altering column types, are not emitted to downstream consumers, leaving it up to the consuming application to handle schema mismatches. This limited schema-change support means your pipeline could break without careful coordination between database migrations and Debezium.
- Limited Transformation and Filtering Capabilities: Debezium captures and propagates row-level changes. It allows Single Message Transforms (SMTs) in Kafka Connect for simple event tweaks, like masking fields or adding timestamps. However, it is limited to one record at a time and does not support advanced use cases such as joining change events from multiple tables or filtering based on external logic. Integration with tools like Apache Flink or Spark is necessary for more complex processing, as Debezium does not handle multi-event transformations or stateful processing. This limitation may be a drawback if you expect more intelligent change processing.
- Latency vs. Consistency Trade-offs: Debezium ensures the order of changes from the source by buffering them per transaction, only emitting changes after a transaction commits to avoid uncommitted data. This means that if a transaction is long-running (e.g., a batch taking an hour), updates remain “stuck” until the commit. If a transaction rolls back, no data is emitted, which could mislead consumers into thinking Debezium is slow. These nuances are essential to recognize when monitoring the stream, as the apparent lag may be due to ongoing database transactions. This limitation is a fundamental aspect of change data capture.
In summary, Debezium is very powerful for what it does (capturing row changes), but it consciously omits a lot of “bells and whistles”. High-throughput workloads can hit performance ceilings unless you engineer around them, and any non-trivial schema modifications or data transformations will require manual handling outside of Debezium. These limitations mean that using Debezium in production often involves building additional tooling or processes on top to fill in the gaps.
Debezium Connector Pain Points by Database
Debezium supports many databases (MySQL, PostgreSQL, MongoDB, SQL Server, Oracle, etc.), and each connector has its quirks and common failure modes. Let’s look at a high-level overview of pain points specific to some popular Debezium connectors, focusing on MySQL, Postgres, MongoDB, and SQL Server. Many relate to initial snapshot troubles, log inconsistencies, transaction edge cases, and version or configuration incompatibilities.
MySQL Connector Issues
| Issue | Description |
| Snapshot Locks | May lock tables or cause metadata lock waits |
| Binlog Retention | If Debezium lags, binlog might be purged |
| GTID Failover | Connector may fail if GTID isn’t on new primary |
| Large Transactions | Cause lag and high memory usage |
PostgreSQL Connector Issues
| Issue | Description |
| WAL Bloat | If replication slot lags, WAL fills disk |
| Plugin Limits | wal2json can cause OOM on large TXs |
| Failover | Logical slot may not transfer |
| Schema Change Visibility | No DDL events emitted in stream |
MongoDB Connector Issues
| Issue | Description |
| Oplog Rollover | Causes silent data loss if Debezium lags |
| No Historical Backfill | Requires separate process to snapshot |
| Large Document Handling | Risk of BSON size errors |
| Sharded Cluster Complexity | Difficult to merge streams, may duplicate data |
SQL Server Connector Issues
| Issue | Description |
| CDC Enablement | Must be manually enabled per table |
| Snapshot + CDC Sync | Needs careful coordination |
| Schema Changes | Require CDC instance update |
| Latency | CDC uses background job, introduces lag |
Each Debezium connector has a set of “gotchas” specific to the database’s quirks. Many of the most challenging issues revolve around initial sync consistency, log retention, and schema alignment between Debezium and the source. Production users of Debezium learn to be proactive in database configuration (binlog/WAL retention, CDC settings), carefully plan schema changes, and monitor the connectors for any sign of trouble in these areas.
Error Handling and Debuggability Problems with Debezium
One of the most frustrating aspects of using Debezium can be diagnosing issues when something goes wrong. Users often encounter cryptic error messages, a lack of clear visibility into Debezium’s internal state, and limited tooling for debugging beyond diving into log files. Here are some common pain points around error handling and observability:
- Cryptic or Opaque Error Messages: When Debezium or Kafka Connect encounters an error, the logged messages can be confusing. For example, suppose a Debezium connector can't find its schema history topic due to misconfiguration or a Kafka issue. In that case, it may log an error like: “Database schema history was not found but was expected… The DB history topic is missing.” While this is clear to developers, it can perplex users who are unfamiliar with terms like "history topic." If Debezium loses its position in the binlog or WAL, it may log an error about a missing file or LSN and then abort, often leaving actionable guidance hidden. Many users are sifting through extensive stack traces to identify the root cause of failures.
- Minimal Automatic Recovery: By default, if a Debezium connector task fails, Kafka Connect marks it as failed and doesn’t restart it until the user intervenes. This safety mechanism can halt a CDC stream due to transient glitches. While Kafka Connect has features for error tolerance, they are more applicable to sink connectors. For Debezium, errors typically require manual intervention to restart connectors, especially if issues arise off-hours, leading to potential lag. Some teams attempt to automate restarts, which may cause loops or repeated snapshots on unrecoverable errors. Overall, Debezium lacks a robust self-healing mechanism, necessitating human oversight.
- Lack of Visibility into Internal State: Debezium's internal state, such as its current read position or snapshot status, isn't readily visible externally. While you can infer some details by checking offsets stored in Kafka or a file, diagnosing issues when Debezium seems “stuck” can be challenging. It's difficult to determine if it's waiting on the database or has stopped entirely. You often need to increase log levels to DEBUG/TRACE and access container logs for detailed insights, which can slow down debugging. For instance, in the MongoDB case, the connector stopped without an obvious error, and only after enabling trace logging could the team identify the issue. Additionally, if Debezium is trailing significantly, it only signals this through lag metrics, making it hard to pinpoint which table's events are causing delays without thorough inspection.
- Monitoring Requires Assembly: Debezium offers metrics via JMX, but you must create a monitoring solution to utilize them. You can track events per second, backlog, and lag to source, but only if you set up a metrics pipeline and know which JMX beans to query. There's no user-friendly UI or CLI for connector status. The Kafka Connect REST API provides some information, but it's low-level. Troubleshooting often requires manually correlating logs, metrics, and database state. For example, if Debezium errors during a snapshot, you may face decisions on whether to turn off the snapshot or resolve the issue and resume, often under time pressure.
- Debugging Schema Mismatches: A common troubleshooting issue arises when consumers fail due to schema mismatches. This error might not appear in Debezium but manifests in the application consuming the CDC stream, such as through an Avro deserializer exception due to a missing field. Understanding if Debezium sent a schema change event is essential for tracing the issue. While Debezium has a separate schema change topic for some connectors (like MySQL, which emits DDL events there), many users are unaware of these events. This lack of documentation awareness can lead to ignoring schema changes logged on a different topic.
- Knowledge and Expertise Required: Effectively debugging Debezium issues requires an in-depth understanding of its design and the source database’s internals. A generalist data engineer might struggle with errors like “The connector requires binlog file X, but it’s not available” or “no known snapshot” WAL error. The steep learning curve can lead to extended downtimes as engineers search for solutions online. For instance, a log message stating “Connector requires binlog file 'mysql-bin.001134', but MySQL only has mysql-bin.001256” indicates a binlog gap that may confuse newcomers. Without context, they might not realize the binlog was purged and miss the necessary fix.
Debezium is not very forgiving with errors, requiring operators to notice and intervene. Its verbose error messages assume familiarity with its architecture, and the lack of built-in monitoring means you'll need to set up your own to catch issues early. This can lead to a longer mean time to recovery in production. Investing in automation, such as scripts to verify Kafka settings, alerts for connector failures, and runbooks for common errors to minimize headaches during failures, is wise.
Should You Use Debezium for CDC? Final Thoughts
Debezium has gained popularity for simplifying change data capture (CDC) integration, but running it in production involves considerable challenges. Issues like operational overhead, technical constraints, connector-specific quirks, and debugging difficulties can complicate deployments. Data engineering teams should be aware of these pain points.
When using Debezium at scale, invest in automation, monitoring, and thorough failure scenario testing. Be prepared for ongoing engineering efforts for tuning and troubleshooting. While Debezium supports real-time data pipelines, it requires careful management. Understanding its limitations allows you to create resilient systems and navigate challenges effectively. Ultimately, successful deployment means addressing these operational and technical hurdles. Evaluate whether the benefits justify the complexities for your specific use case. Happy streaming, and watch those lag metrics!
If you’re already facing some of these challenges, it might be worth exploring modern alternatives. See how teams are migrating from Debezium to Estuary for real-time CDC with lower operational overhead.
FAQs
Does Debezium support exactly-once delivery for CDC events?
How does Debezium handle database schema changes?
What happens if Debezium loses its position in the WAL or binlog?
How do I monitor Debezium lag in production?

About the author
Dani is a data professional with a rich background in data engineering and real-time data platforms. At Estuary, Daniel focuses on promoting cutting-edge streaming solutions, helping to bridge the gap between technical innovation and developer adoption. With deep expertise in cloud-native and streaming technologies, Dani has successfully supported startups and enterprises in building robust data solutions.


