The world of data in business is complex and vast but its heart lies in answering a simple question – what is data flow? As we depend more heavily on data in contemporary businesses, understanding this concept of data flow is more crucial than ever before. Visualize it as a roadmap, demonstrating data movement from one point to another within a system.
Establishing a data flow system that can handle a variety of data types and adapt to your growing needs can be a demanding job. Addressing this challenge, in turn, becomes an essential aspect of operational effectiveness.
Today, we will unveil the notion of data flow, discuss its various components, explore its diverse types, and unravel the complexities of a Data Flow Diagram (DFD). By the end of this guide, you’ll have a holistic understanding of data flow, its influence on business optimization, and an up-to-date view of data flow pipelines.
What is Data Flow?
Data flow is the lifeblood of your system, carrying valuable information from its source to its destination and following a specific sequence of steps. Data flow provides the necessary information to the parts of your system that need it most.
Data can stream in from a multitude of sources:
- Sensors: Collect data on physical phenomena like temperature or pressure.
- User input: Data is entered by users into applications, such as word processors or spreadsheets.
- Transactional systems: These include eCommerce websites or customer relationship management (CRM) systems generating data.
In any system, data flows to various destinations, which can include:
- Data warehouses: These are repositories of data that can be used for analysis and reporting.
- Applications: They use data to provide insights, make decisions, or automate processes.
- Data marts: Smaller, specialized data warehouses that are utilized by specific departments or business units.
How Do Data Flows Address Modern Data Needs?
These days, we are not just creating data - we're creating it at breakneck speed. Our sensors, transactional systems, and user inputs are working around the clock, generating data like there's no tomorrow. So how do you manage this data? The answer lies in optimizing the data flow process.
Data flow can help organizations:
- Collect data from a variety of sources
- Clean data by removing errors and inconsistencies
- Transform data into a format usable by applications
- Store data securely in a data warehouse or data mart
- Access data by providing users with various tools and interfaces
4 Major Components Of A Data Flow
A data flow comprises several fundamental components:
- Data Source: These are the origins of data within a flow and it can have multiple data sources, including database tables, XML files, CSV files, spreadsheets, and more.
- Data Mapping: This involves matching fields from the source to the destination without necessarily changing the data. It's like drawing a route for the data to follow.
- Data Transformation: These operations modify data before it reaches its destination.
- Data Destination: These are the end-points of a data flow and can be as diverse as the source types.
Exploring The Different Types Of Data Flow
Data flow can be classified into 2 primary types:
- Streaming data flow processes data in real-time, as soon as it’s generated. Perfect examples would be sensor data, social media updates, or financial market data.
- Batch data flow on the other hand processes data in large, batched groups, typically at regular intervals. This method is commonly used when dealing with a large amount of data that doesn't need immediate processing - think financial, sales, or customer data.
Now that we’ve understood data flow and its different components and types, let’s discuss how this knowledge can help in using a data flow diagram.
Navigating Data Flow Diagrams: A Step-by-Step Approach To Understanding & Utilizing It
A Data Flow Diagram (DFD) is a tool that gives us a clear picture of how data moves through a process or a system. It is an illustration of the data's journey including its sources, destinations, and the processes it undergoes.
DFDs can vary in complexity. They might be simple, depicting only general processes, or they could be complex, representing multi-tiered, intricate systems. In either case, their primary aim is to provide a clear, visual guide to the data flow within a given system.
Breaking Down The Components Of A DFD
DFDs rely on 4 key types of components that ensure their effectiveness and readability:
- External Entity: These are also referred to as terminators, sources, sinks, or actors, and play a crucial role in data interaction. They provide data to the system or receive data from it and are often visualized at the edges of the diagram.
- Process: This component is the transformation powerhouse of the system. It performs computations, sorts data, or redirects data flow based on established rules.
- Data Storage: It is the storage unit of the system that can take many forms like a database, an optical disc, or even a physical filing cabinet.
- Data Flow: This acts as the conveyor belt of the system ensuring the transfer of information between different parts of the system. Note that this flow can be bidirectional.
Decoding The Language Of Data Flow Diagram Symbols
Data Flow Diagrams use a variety of symbols to represent the 4 core components – processes, external entities, data storage, and data flow. Different DFD conventions employ different symbols for these components.
Here's a straightforward rundown:
- Yourdon and DeMarco Convention: This convention uses circles for processes, squares or rectangles for external entities, parallel lines for data storage, and arrows to show data movement.
- Gane and Sarson Convention: In this convention, processes are represented by lozenges or rounded rectangles, external entities by squares or rectangles, data storage by open-ended rectangles, and arrows indicate data transit routes.
- Structured Systems Analysis and Design Method (SSADM) Convention: This convention uses squares or rectangles for processes, ovals for external entities, open-ended rectangles for data storage, and arrows to represent data flow.
- Unified Convention: In this convention, external entities are depicted as stick figures, processes as squares labeled "Process," data storage as rectangles labeled "Entity," and arrows indicate the flow of data.
Dual Perspectives Of Data Flow Diagrams: Logical & Physical
When working on Data Flow Diagramming, it's important to understand the 2 distinct views that we can apply: the Logical view and the Physical view. Each offers a unique perspective and is useful at different stages of system design.
Logical Data Flow Diagram: Abstract Mapping
The Logical Data Flow Diagram is like a simple guide. It doesn't cover tiny details of the processes but mainly concentrates on what's happening. As a result, it gives a simple overview, showing what kind of data is used, where it starts, where it ends, and the changes it goes through
For instance, in a banking software system, a logical DFD might illustrate how customer details flow from an entry form to a database, or how transaction information moves from the database to a monthly statement.
Physical Data Flow Diagram: Practical Blueprint
The Physical Data Flow Diagram, on the other hand, tells us how the system works. It shows the specific software, equipment, and people that help the system function.
In the case of the banking software example, a physical DFD would show the exact database tables where customer information is kept, the software part creating monthly reports, and even the people who work in this process.
Understanding The Levels Of Data Flow Diagrams
DFDs offer visual representations of a system's information flow. DFDs can be categorized into different hierarchical levels depending on the depth of detail needed.
Level 0: Contextual DFD
This is the most abstract level of a DFD, known as a context diagram. It encapsulates the entire system within a single process, showcasing interactions with external entities. This diagram offers a macro view of data inputs and outputs.
Level 1: Functional DFD
A level up, we have the Level 1 DFD which breaks the single process from Level 0 into multiple sub-processes. Here, each subprocess serves a specific function within the system. This level breaks down our system knowledge by displaying the main operations.
Level 2: Detailed DFD
At Level 2, each of the subprocesses from Level 1 is further dissected into their subcomponents. This additional layer provides a detailed view of the system’s mechanisms and how they interrelate, bringing us a step closer to the actual implementation details.
Level 3: In-Depth DFD
Level 3 shows every small detail of a system. It tells us what goes in, what happens inside, and what comes out of each part. It's used for complex systems and it's effective because it lets us fully understand each step.
Now that we know about different levels of data flow diagrams, how about building one of your own? Let’s see how to go about it.
5 Step Guide To Making Your Data Flow Diagrams
Creating a data flow diagram involves a systematic approach. Here's how it can be achieved effectively:
Step 1: Determine System Outcomes
The first step is to identify the system or process to be analyzed. Define the objectives of this exercise. These could be identifying bottlenecks, improving internal processes, or enhancing system understanding within the team.
Step 2: Identify Components Of The DFD
Next, it's important to classify the elements of the chosen methodology. This involves identifying external entities, data inputs and outputs, data storage, and process steps. Start by finding the primary inputs and outputs to get a clear overview of the system.
Step 3: Develop A Context Diagram
The third step is to create a context diagram or a level 0 DFD. The diagram should connect major inputs and outputs to external entities, illustrating the general data flow path.
Step 4: Expand The Context Diagram
Once the context-level diagram is done, go deeper. Make the diagram bigger by turning it into a level 1, 2, or 3 DFD. This means adding more things and linking them to smaller steps and systems.
Step 5: Verify The DFD
Once the diagram is complete, check its accuracy. Review each level and step carefully, focusing on the flow of information. Confirm that the data flow aligns with the actual system operations and that all necessary components are present. Finally, check for clarity and comprehension by sharing it with team members.
Real-Life Use Cases: The Power Of Data Flow In Business Optimization
Data movement helps organizations in efficient decision-making and strategic planning. Let’s discuss some actual use cases where companies have successfully employed data flow over the years.
Spotify
Spotify uses data flow to analyze user listening habits and recommend new music. The company collects data on what songs users listen to, how often they listen to them, and when they listen to them.
Once Spotify has this information, it uses it to make a specialized playlist for you. This playlist includes songs that match your music taste.
The New York Times
The New York Times utilizes data analytics to understand what its readers are interested in. They do this by tracking which articles people read, where these readers are located, and how much time they spend on each article. This process of collecting and analyzing data helps them understand their readers' preferences and habits.
For instance, if they notice that many of their readers are showing interest in articles about climate change, they might decide to focus more on that topic. This way, they're responding to their readers' interests and providing more of the content that their readers want to see.
BlaBlaCar
A ride-sharing service, BlaBlaCar captures data and constantly collects information about its users' locations, travel times, and budgets. This information is then used to match drivers with passengers and to ride prices.
Moreover, the data collected by BlaBlaCar allows them to dynamically adjust pricing based on real-time demand and supply. For instance, if there is an abundance of available drivers in a specific geographical area, BlaBlaCar can lower the price of rides in that region to incentivize more passengers to choose their service.
PLAID
As a fintech firm, PLAID employs big data analytics to link banking institutions with different applications, offering users a holistic view of their financial status. They collect data from a range of sources including bank accounts, credit cards, and other financial accounts. They use these details to make a one-stop spot where users can look at all their money matters.
StreamElements
StreamElements watches live streaming data to give broadcasters information about their viewers. They look at how many people are watching, their location, and how long they watch a particular video. This data helps video producers to make their programs better and focus on engaging content that aligns with viewers' preferences and holds their attention for longer durations.
By analyzing viewer data, StreamElements provides valuable demographic and behavioral insights to help advertisers target their ads effectively. This targeted advertising approach ensures that viewers are presented with relevant and engaging advertisements, creating a more personalized viewing experience and increasing the chances of ad engagement.
Amazon
Amazon applies data flow to track user shopping habits and to provide recommendations. The company collects a vast amount of data about its users, including their browsing history, purchase history, and search history. This data is then used to create a detailed profile of each user's shopping habits. Amazon uses this profile to recommend products to users that they are likely to be interested in.
Estuary Flow: Revolutionizing Data Flow Pipelines
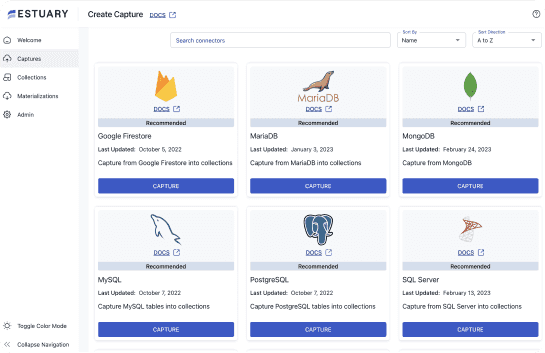
Our platform, Estuary Flow, brings a fresh approach to the data flow. It serves as a bridge to connect the diverse systems involved in data production, processing, and consumption, while ensuring millisecond-latency updates for an efficient workflow.
Here's what an Estuary Flow pipeline can do for you:
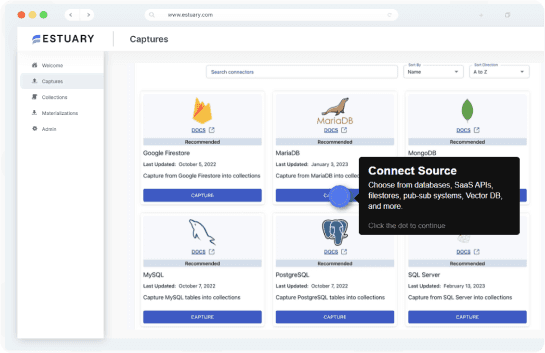
- Data Capture: It captures data from your systems, services, and SaaS, storing them in millisecond-latency datasets termed collections. These collections exist as regular JSON data files in your cloud storage bucket, ready for processing.
- Materialization: Flow allows you to generate a view of a collection within another system, such as a database or a key/value store. You can even leverage a Webhook API or pub/sub service, making your data access flexible and efficient.
- Real-time Data Transformation: Estuary Flow allows you to create new collections derived from existing ones. It facilitates the execution of complex transformations involving stateful stream workflows, joins, and aggregations in real time.
In addition to the points mentioned above, Estuary Flow also offers other features that make it a powerful and versatile data flow platform. These features include:
- Reduced Costs: Estuary Flow helps reduce costs by providing a more efficient way to process data. This can help you to save money on hardware, software, and labor costs.
- Improved Data Quality: Estuary Flow improves data quality by providing a single source of truth for data. This can help to reduce errors and improve the accuracy of your data.
- Increased Data Security: Estuary Flow increases data security by providing a secure environment for data processing. This can help to protect your data from unauthorized access and tampering.
Conclusion
Key Takeaways:
- Data flow is vital for modern businesses, facilitating information movement within systems.
- Components like sources, mapping, transformation, and destinations shape data flow, with streaming and batch being the primary types.
- Data Flow Diagrams (DFDs) visually represent data movement, aiding analysis, and platforms like Estuary Flow optimize data pipelines for efficient processing.
As you embark on your journey into understanding what data flow is, remember that it is a dynamic and evolving field. Stay curious, keep exploring, and embrace the constant advancements in technology and data management. By doing so, you can unlock endless possibilities and contribute to the ever-expanding world of data-driven innovation.
Whether you are choosing to build your own data flow system or opting for ready-made tools, remember that the aim is to ensure your data flow remains seamless and effective. This will effectively manage your valuable data resources.
Estuary Flow is a testament to how well-structured data flow pipelines can significantly improve our data management. So don’t hesitate to sign up and start building effective data flow systems. Should you have any queries or require further assistance, feel free to reach out to us.

About the author
With over 15 years in data engineering, a seasoned expert in driving growth for early-stage data companies, focusing on strategies that attract customers and users. Extensive writing provides insights to help companies scale efficiently and effectively in an evolving data landscape.


