Tracking customer transactions from mobile sales applications and CRM sources, such as Shopify POS data, and loading that data into data warehouses is essential for gaining a comprehensive view of customer orders, sales performance, and product trends.
In this article, we will be walking through the process of extracting transactional data from your Shopify store and loading it into a Snowflake-based data warehouse. This will allow us to perform advanced analytical queries and create a Streamlit dashboard, which is directly integrated within Snowflake, to gain valuable insights into customer behavior using key metrics such as payment status, demographics, sales, and orders categorized by product type and vendor.
Overview on Shopify
Shopify is a cloud-based e-commerce platform that enables you to create, manage, and scale your business to maximize performance. It offers built-in products that help small and medium-sized e-commerce businesses efficiently manage their web-based store, product marketing, and inventory workflows.
The Shopify platform offers services for online retailers, including payments, marketing, shipping, and customer engagement tools. The key advantages of using Shopify include the ability to build an online store, manage sales, target niche markets, and accept payments through secure gateways without needing deep expertise in programming or web design.
Overview on Snowflake
Snowflake is a fully managed, cloud-based platform that serves as a centralized location for relational data warehousing.
The platform can efficiently handle large volumes of data—structured, unstructured, and semi-structured—making it an ideal destination for ETL/ELT processes. This helps you manage varied data processing requirements, including comprehensive analyses for improved decision-making.
Why integrate Shopify into Snowflake
- Centralized Data Store for Enhanced Analytics: By integrating Shopify with Snowflake, you can centralize all your e-commerce data in one place, simplifying the process of performing advanced analytics. Snowflake's cloud-native architecture enables seamless querying across both structured and semi-structured data (such as JSON), allowing you to analyze sales trends, customer behavior, and marketing effectiveness. By combining Shopify data with other sources, such as Google Ads, Facebook Ads, and TikTok Ads, you can elevate your insights and enable data-driven decision-making for your online store.
- Automation: Automate and scale manual, time-consuming Shopify reporting processes currently handled in spreadsheets.
- Advanced Analytics and Dashboarding: Use Snowflake to perform analytical queries and advanced analytics, enabling you to extract valuable insights that go beyond Shopify's native reporting capabilities.
Prerequisites
To follow this Shopify to Snowflake integration tutorial, you will need:
- A Shopify Admin Account
- An Estuary Account
- A Snowflake Account
Shopify to Snowflake Integration Using Estuary Flow
There are multiple ways to integrate Shopify with Snowflake, including using third-party platforms or manually extracting data via the Shopify GraphQL API. However, manual integration can be time-consuming, error-prone, and lacks real-time capabilities. A more efficient approach is leveraging Estuary Flow, which automates the data pipeline, ensuring seamless, real-time data synchronization between Shopify and Snowflake.
Estuary Flow is an efficient ETL (Extract, Transform, Load) and CDC (Change Data Capture) platform that allows real-time data transfer between a range of sources and destinations. Whether you’re looking to set up real-time or batch ETL or ELT data integration, Estuary Flow can help you do so from the ground up in just a few minutes.
By leveraging the many features of Estuary Flow, you can optimize your data workflows and unlock the full potential of your Shopify data in a Snowflake data warehouse.
Step 1: Configure Shopify Account
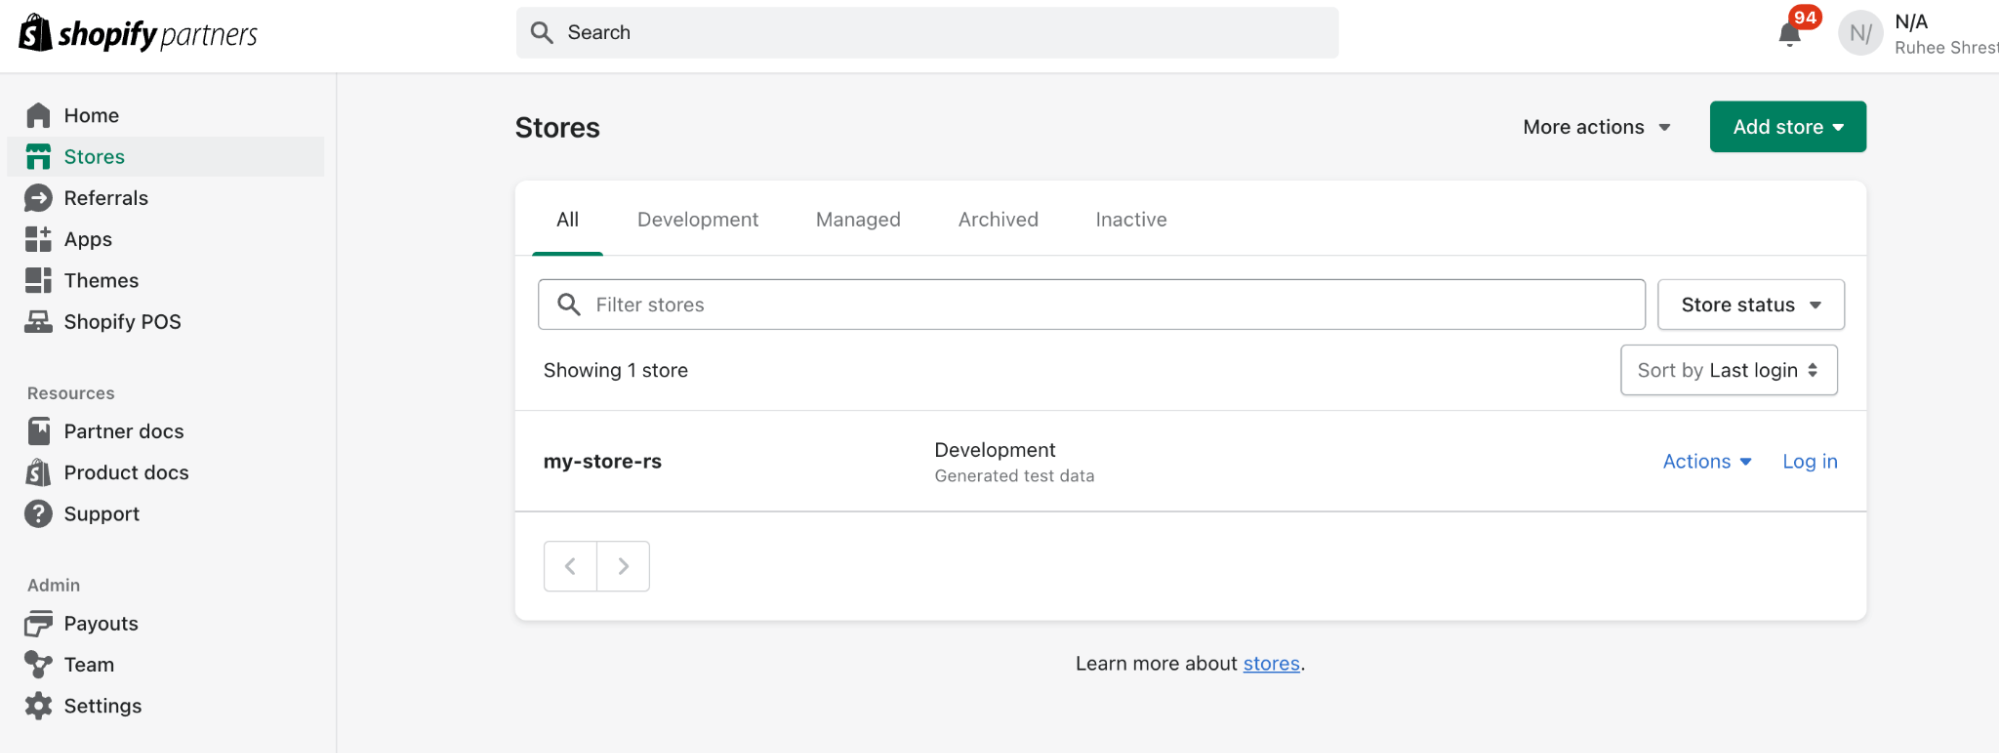
- Create a Shopify Partner’s Account, and create a store. I named mine “my-store-rs”.
- Create a Shopify Admin Account and login using email. You will be able to pick the store you created.
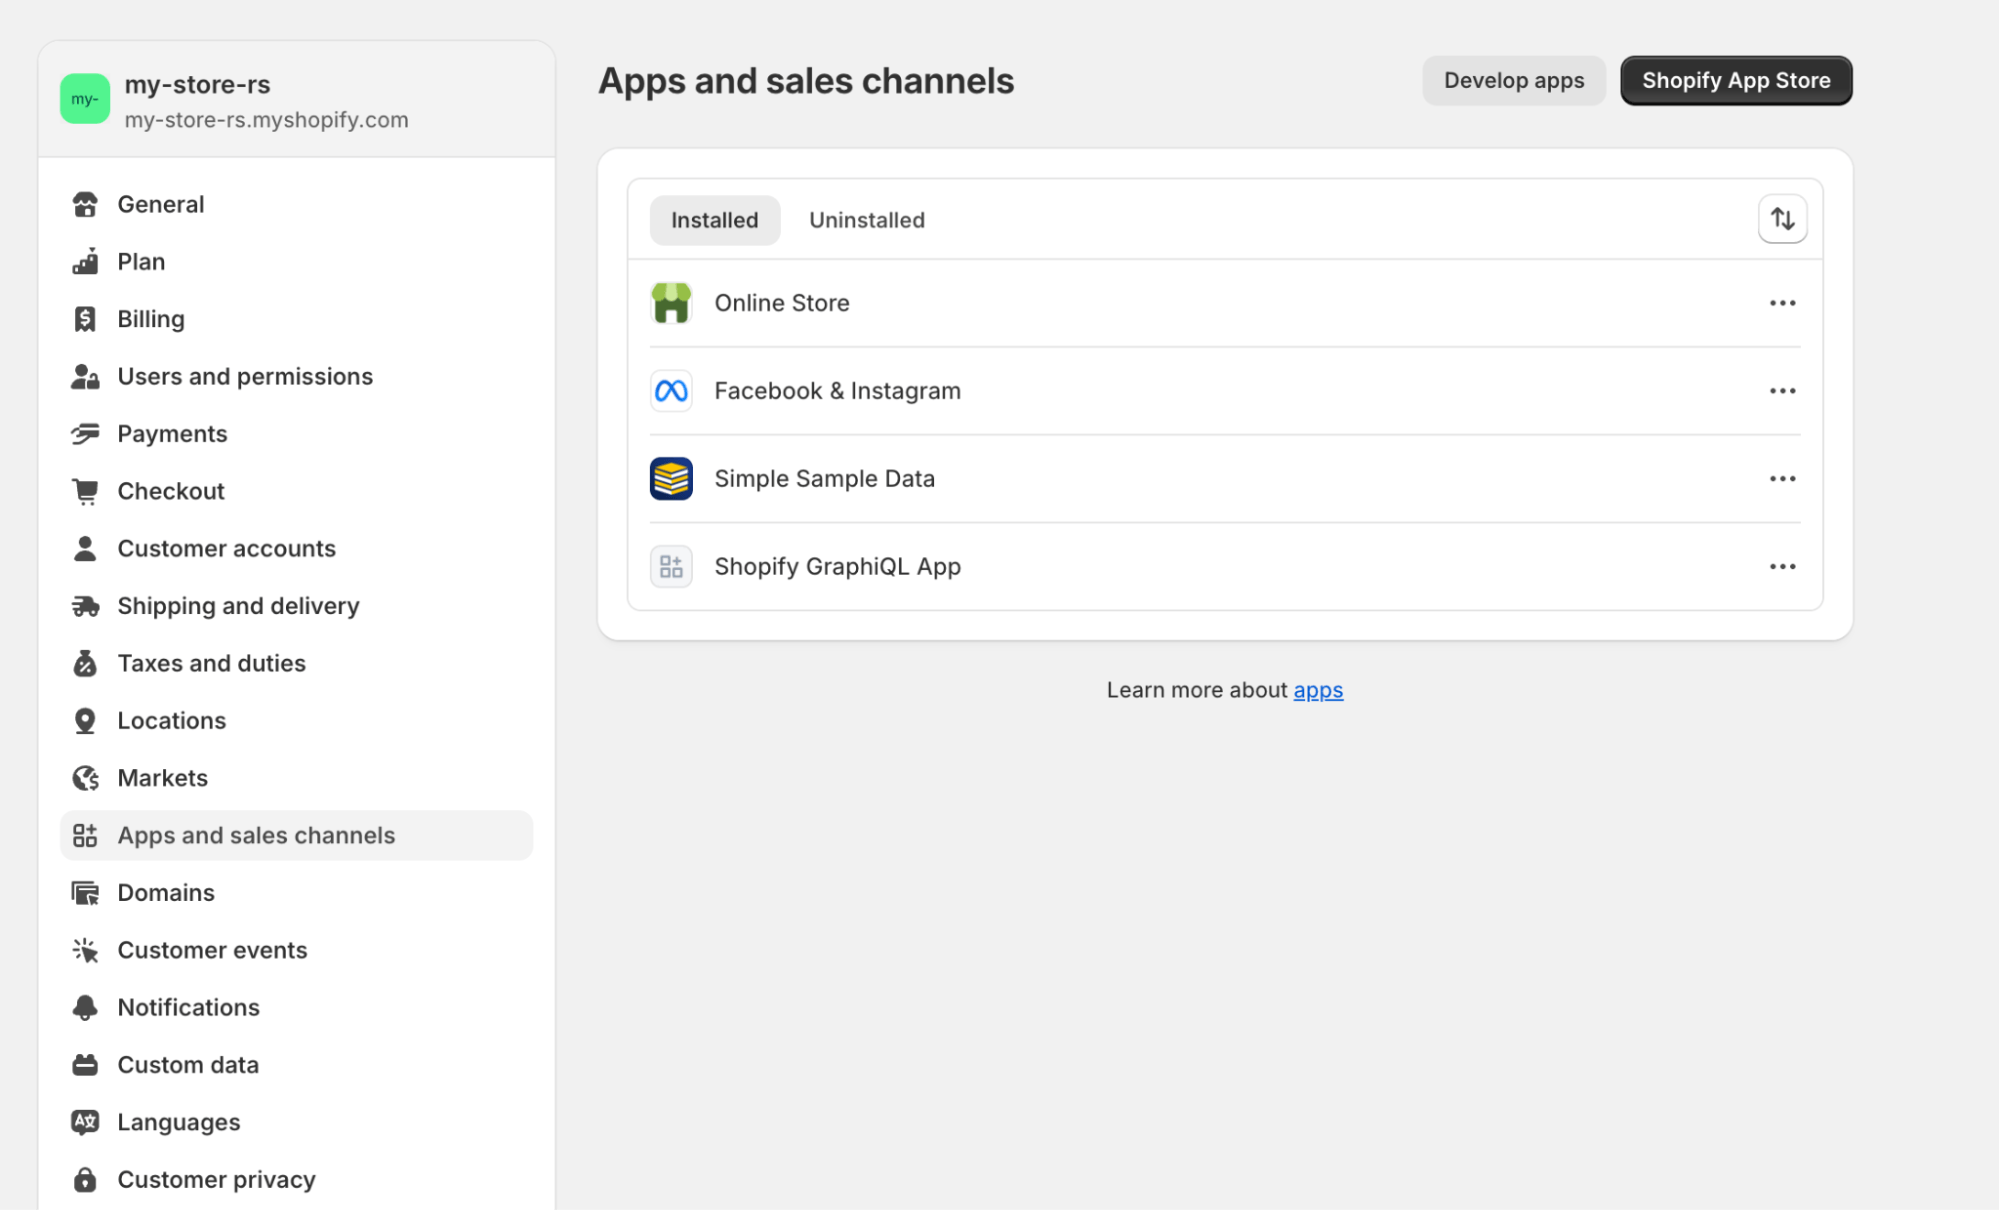
- Go to Settings, and Apps and Sales Channels, and add the following apps:
- Online Store - To customize your website
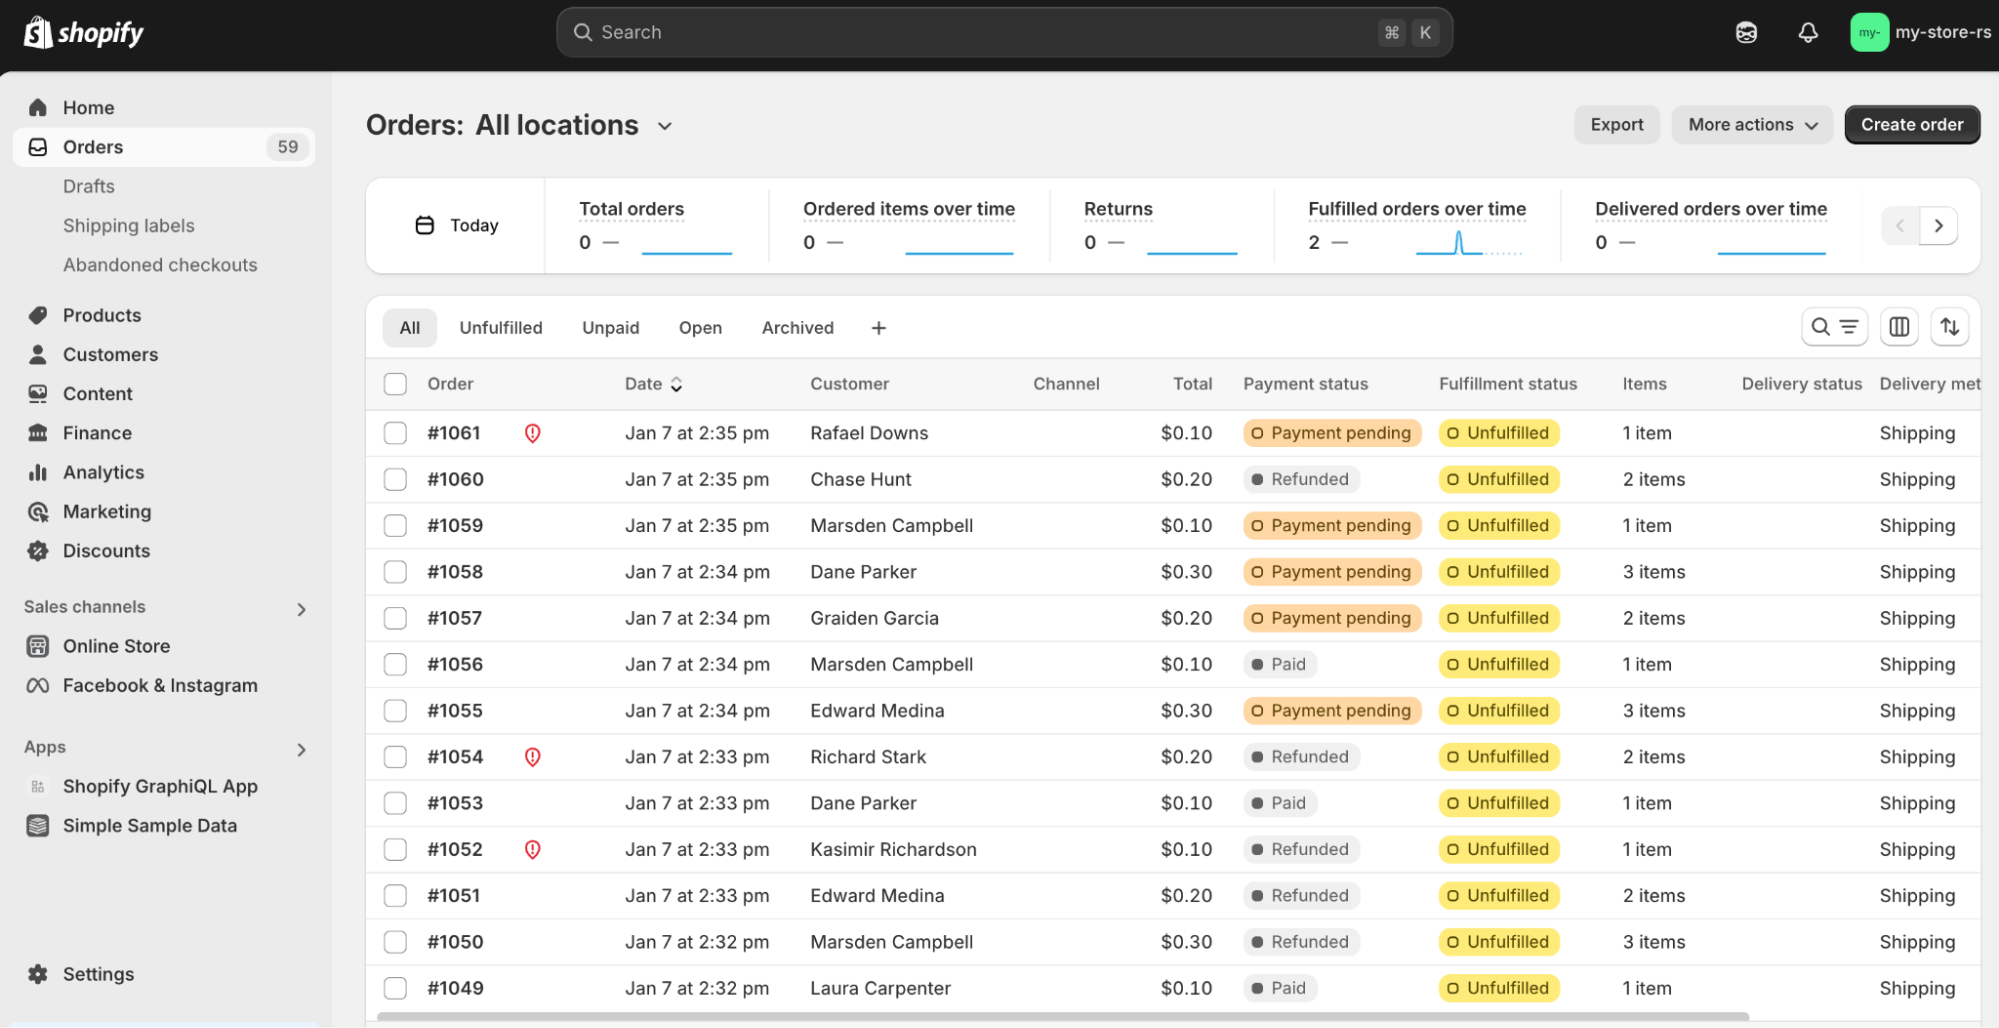
- Simple Sample Data - Install Mock Data to your store - to include Products, Customers, Orders.
- Shopify GraphQL App (Optional) - To query your mock data in GraphQL before loading it into Snowflake
- Facebook and Instagram (Optional) - To connect Facebook Ads Account to track customers
- Navigate back to your Dashboard, and you can see the mock data in Orders, Products and Customers is populated.
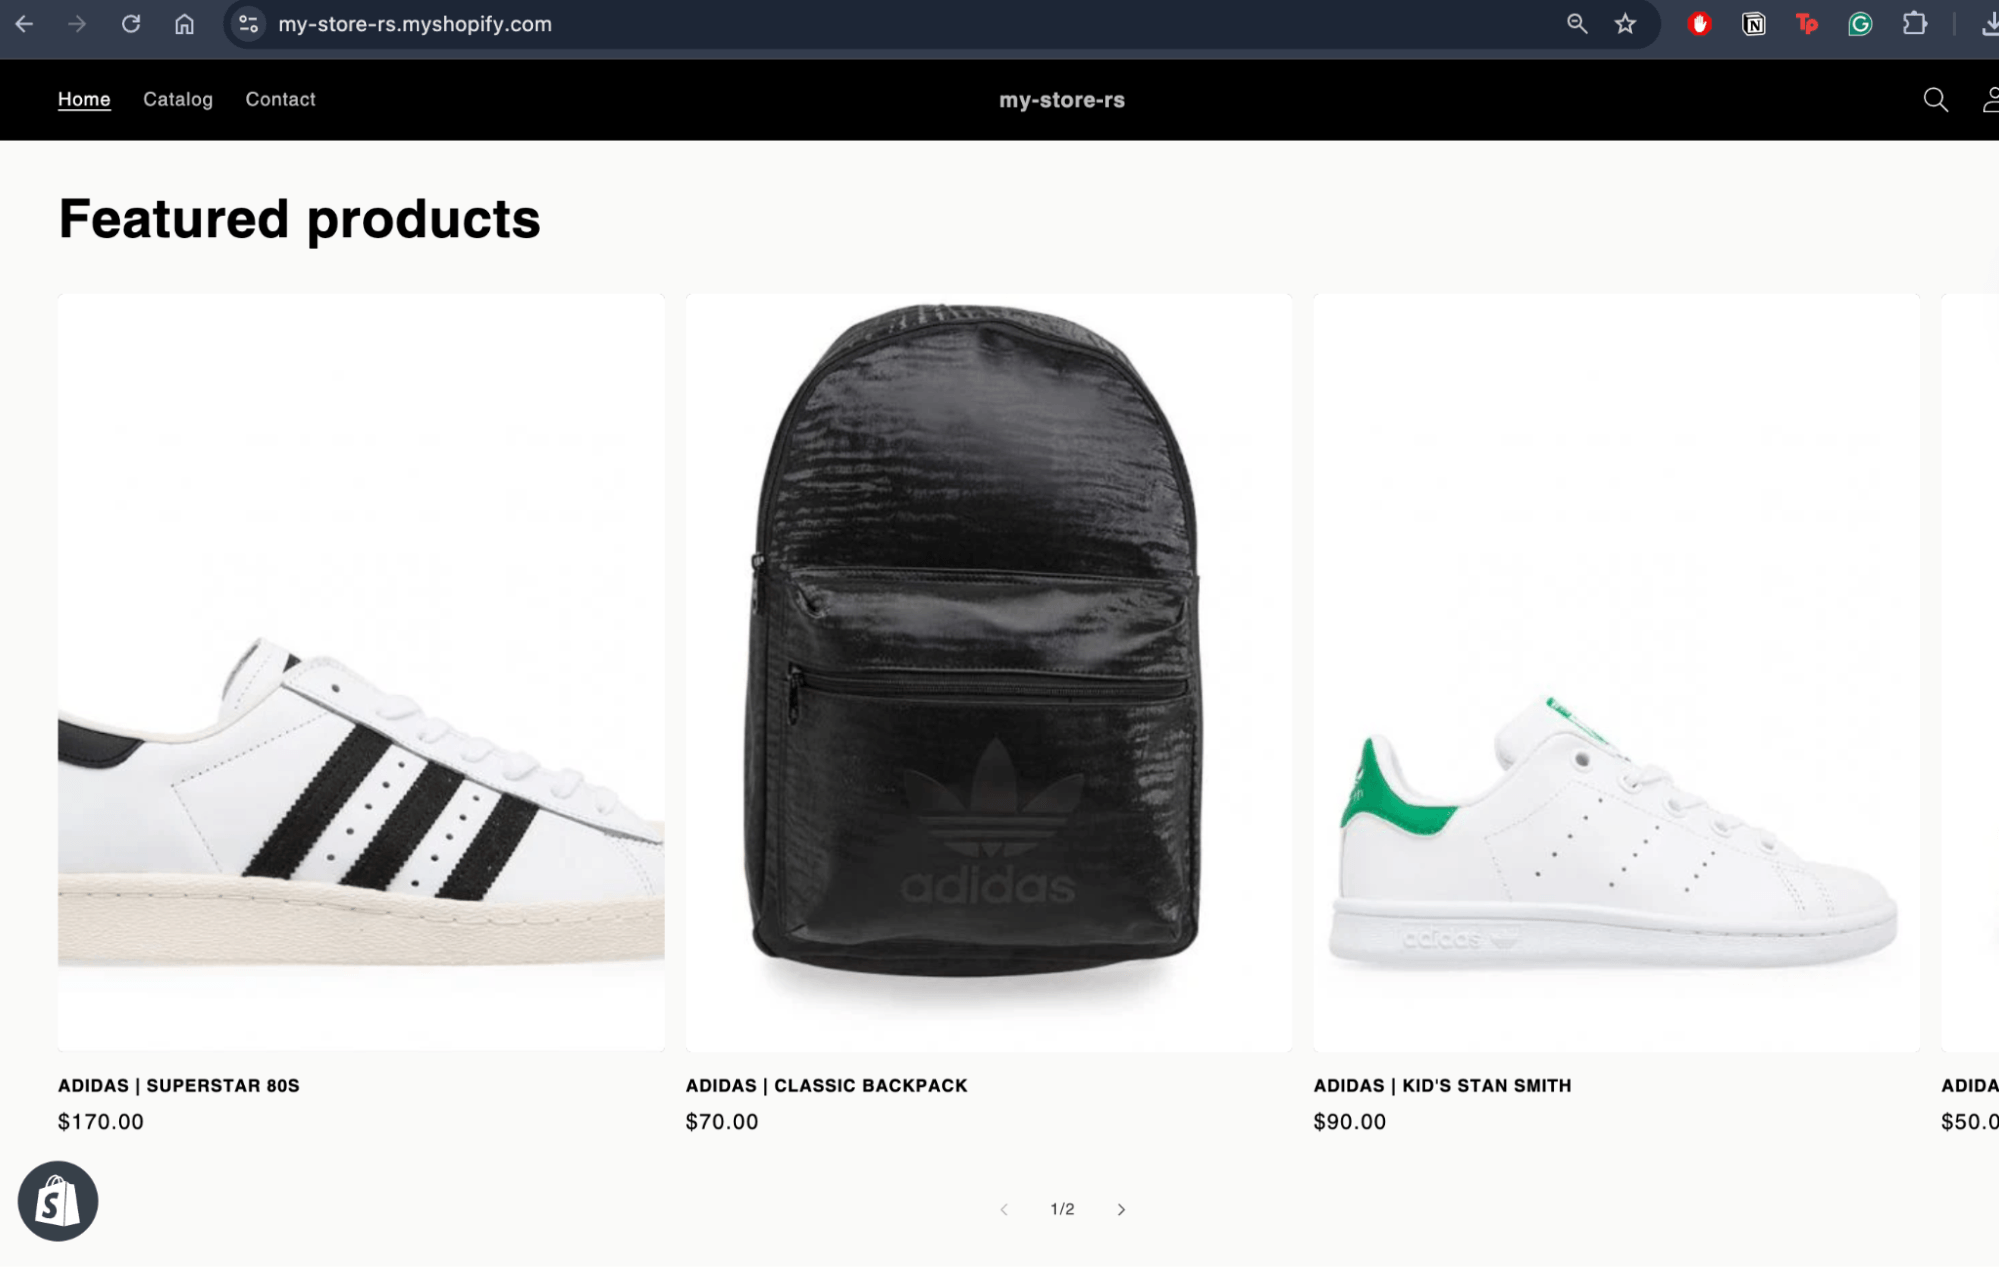
- Navigate to your store by going to Online Store and click on view store:
Step 2: Configure Shopify in Estuary
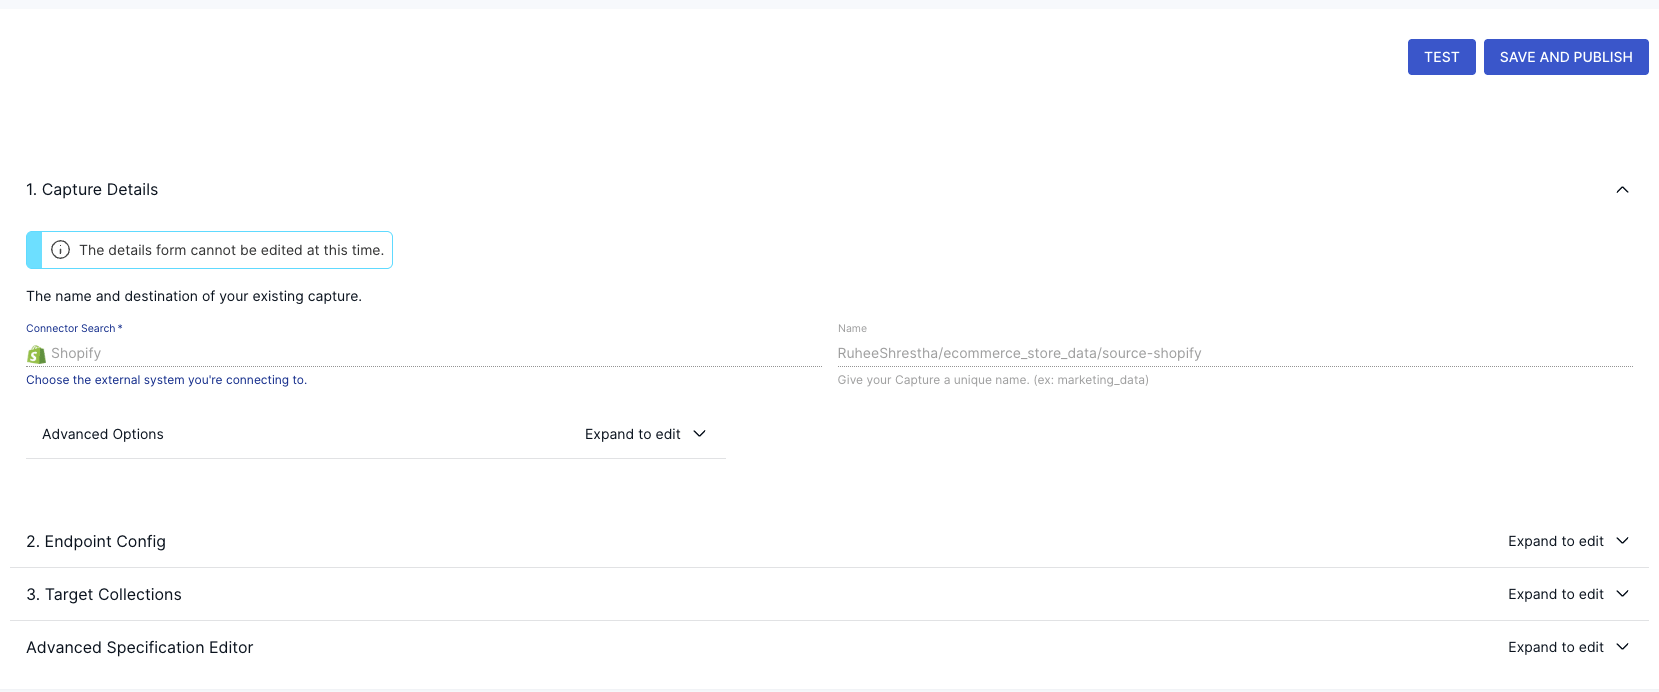
- Now that you are done setting up your Shopify Store, login to your Estuary Account and add Shopify as the Source Connector! Pick Shopify or Shopify (Graph QL) if you are using Shopify GraphQL API to retrieve and query your data. While this demo will use the first option (the Shopify REST connector), the GraphQL connector will become the preferred choice as it becomes more fully-featured. This is because Shopify is in the process of deprecating their REST API in favor of their GraphQL API.
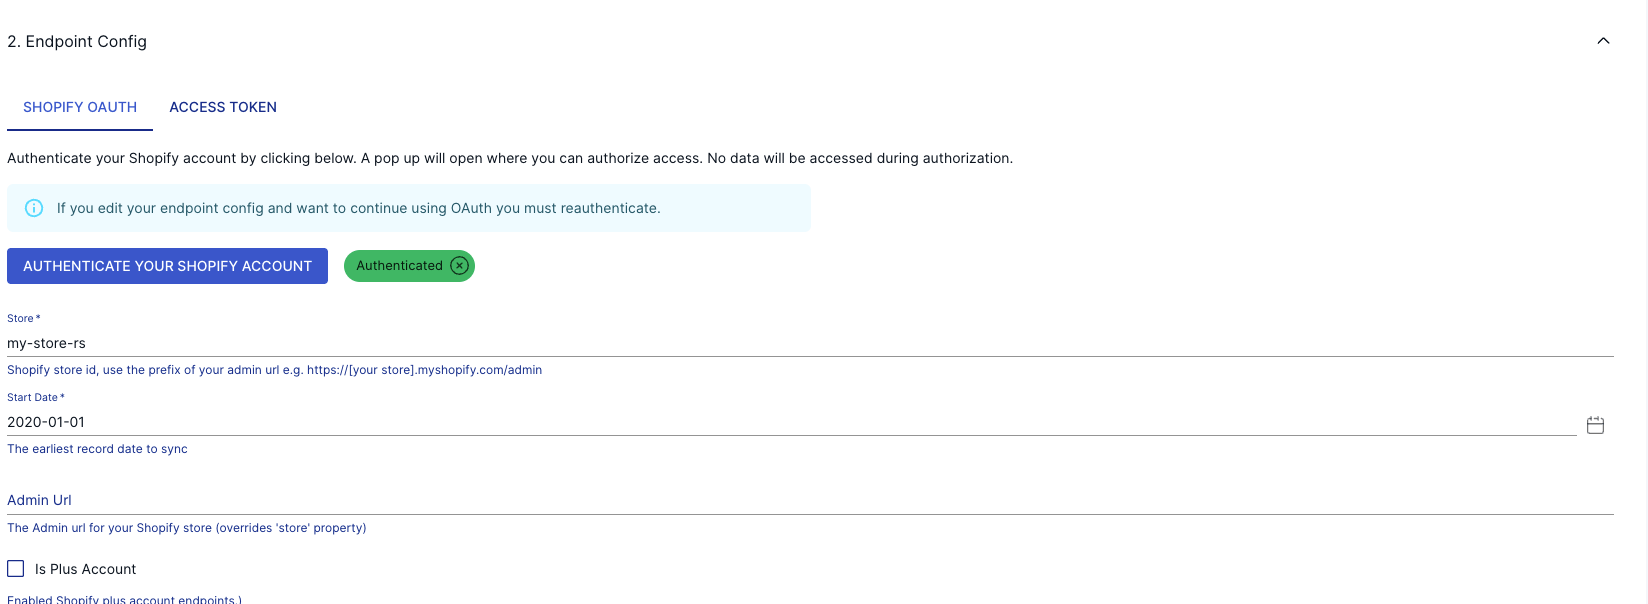
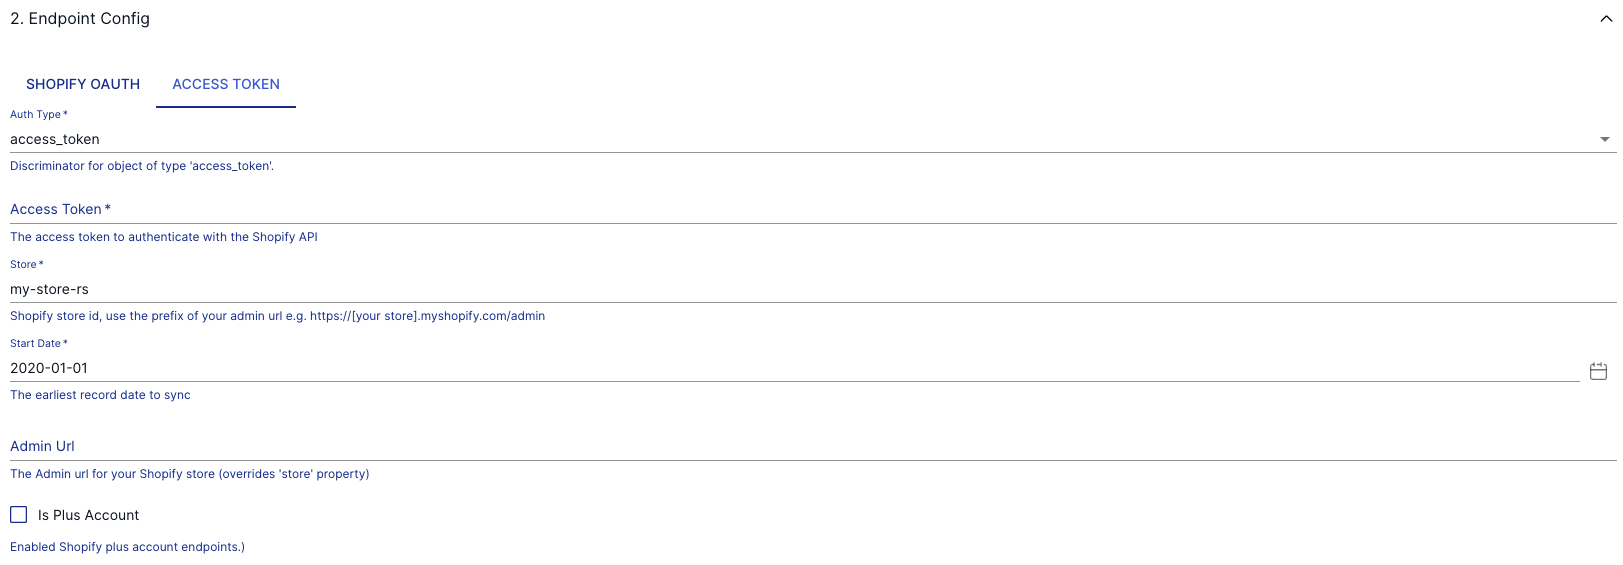
- On the Shopify connector configuration page, fill in the necessary fields, including:
- Name: Provide a unique name for your capture.
- To authenticate your Shopify account, use either the SHOPIFY OAUTH or the ACCESS TOKEN option.
- Your ACCESS_TOKEN can be found in Shopify Admin, after creating an App. Once the app is installed, Shopify will generate an Admin API access token for the app.
- Store: Specify your Shopify store ID.
- Start Date: This is the earliest record date to sync your data.
- After filling out all the mandatory fields, click NEXT on the top right corner of the page.
- Finally, click SAVE AND PUBLISH to complete the source connector configuration.
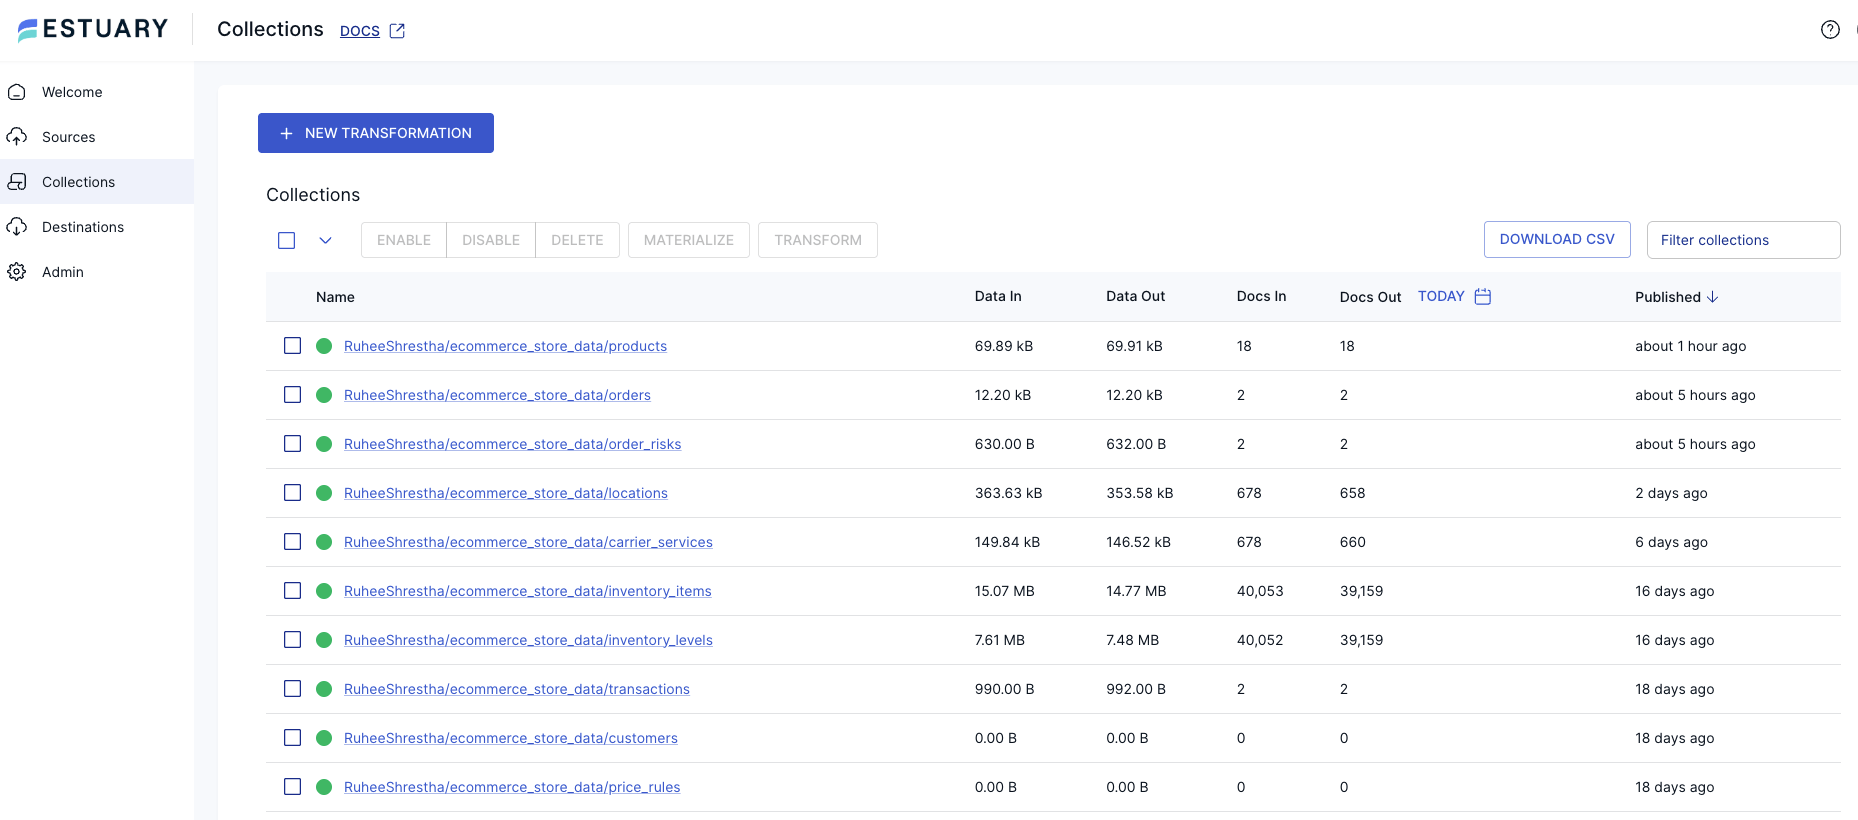
This batch connector will capture data from your Shopify account and convert it into a Flow collection.
In your collections, you can find the tables generated.
Step 3: Configure Snowflake as the Destination
- After a successful capture, you will see a pop-up window summarizing the capture details. Click on MATERIALIZE COLLECTIONS in this pop-up to proceed with configuring the destination end of the data pipeline.
- Use the Search Connectors field on the Create Materialization page to look for the Snowflake connector.
- Click on the Materialization button of the Snowflake connector when you see it in the search results.
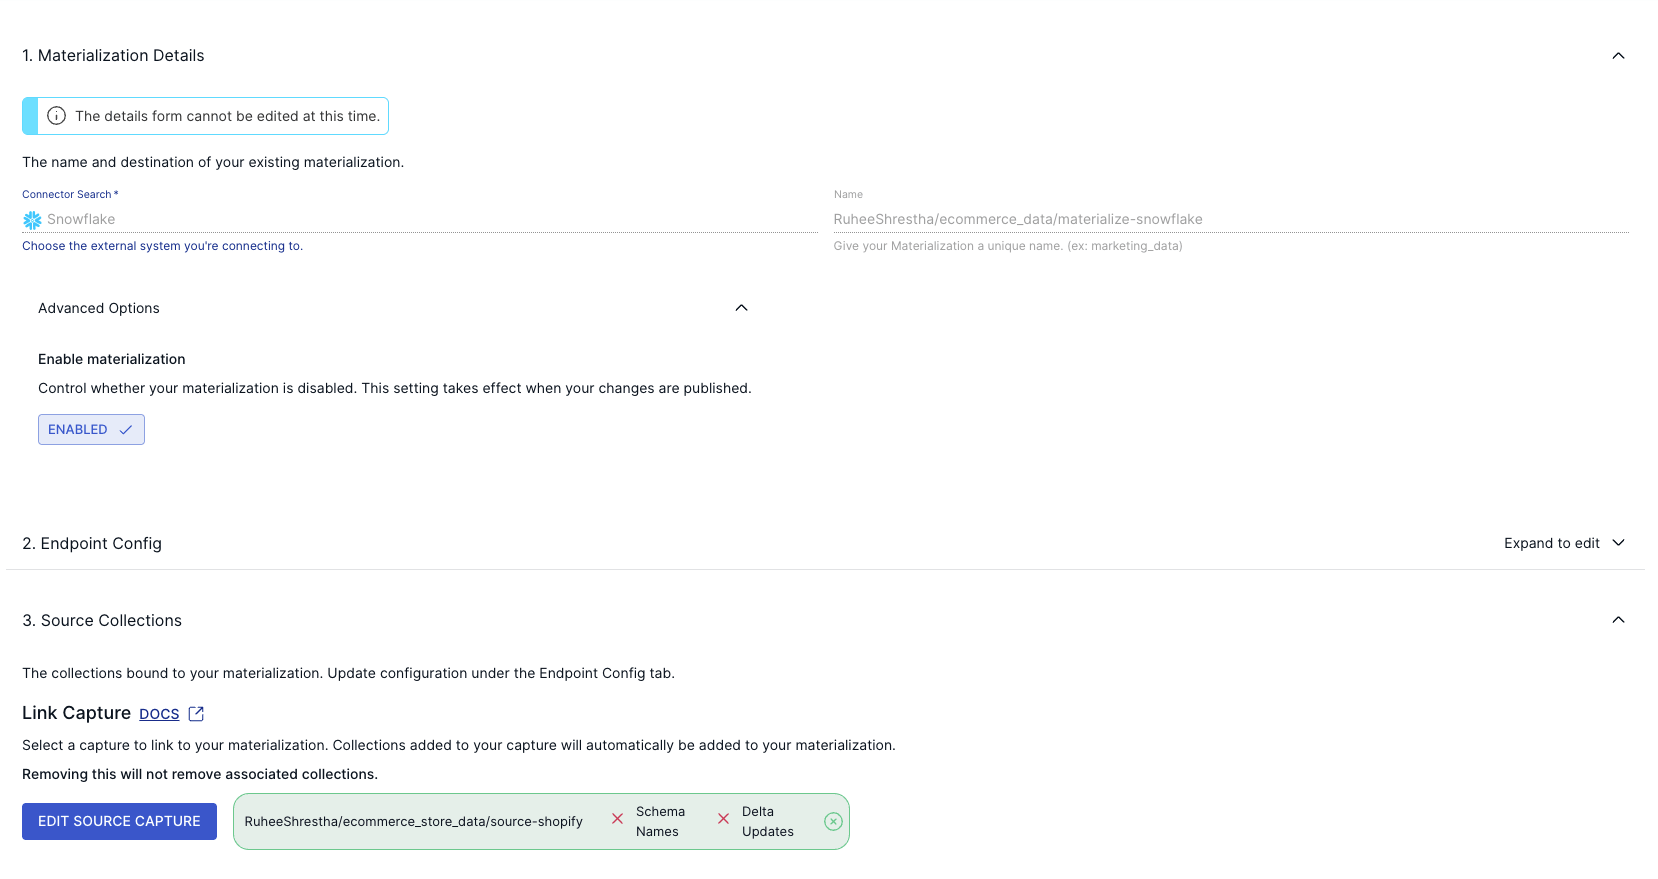
- Name your Destination of your existing Materialization
- Add your Endpoint Config (see our script to help simplify setup with Snowflake), which includes:
- Host (Account Url): <account_name>.snowflakecomputing.com
- Database Name: <your_db_name>,
- Schema Name: <your_schema_name>,
- Warehouse Name: <your_warehouse_name>,
- Role (Optional): <your_role>,
- Account (Optional): <account_identifier>
- Authenticate using your USER PASSWORD or PRIVATE KEY.
- Link Capture from Source
- If the collection of the capture from your Shopify account hasn’t been automatically added to your materialization, use the Source Collections section to do this manually.
- Finally, click on NEXT > SAVE AND CONTINUE to complete the configuration process.
Step 4. Performing Analytics in Snowflake
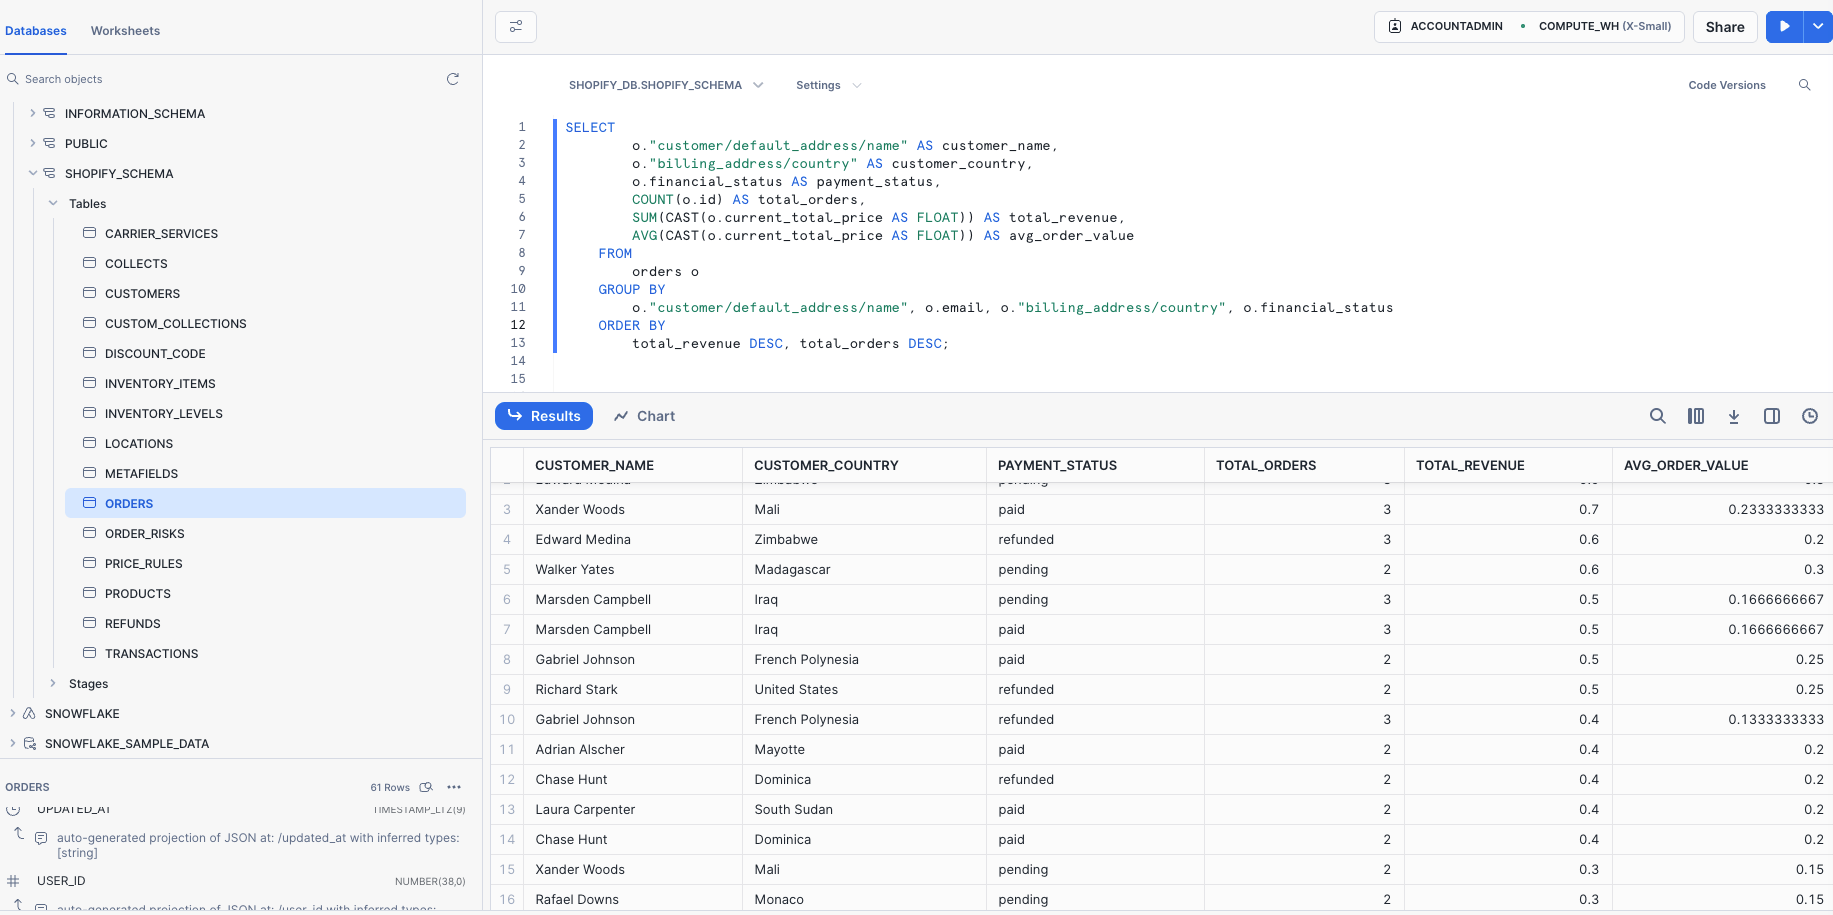
Once the data is loaded into Snowflake, navigate to your Snowflake account to perform analytical queries such as:
plaintextSELECT
        o."customer/default_address/name" AS customer_name,
        o."billing_address/country" AS customer_country,
        o.financial_status AS payment_status,
        COUNT(o.id) AS total_orders,
        SUM(CAST(o.current_total_price AS FLOAT)) AS total_revenue,
        AVG(CAST(o.current_total_price AS FLOAT)) AS avg_order_value
    FROM
        orders o
    GROUP BY
        o."customer/default_address/name", o.email, o."billing_address/country", o.financial_status
    ORDER BY
        total_revenue DESC, total_orders DESC;
This query is useful for analyzing customer behavior and revenue, such as identifying high-value customers by analyzing order patterns by country or payment status, and determining average order values to inform marketing or sales strategies.
Step 5: Creating a Customers Orders and Sales Analysis Dashboard in Streamlit
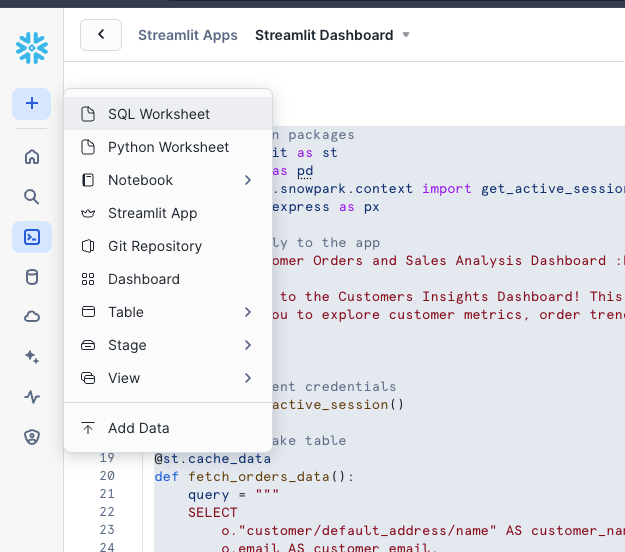
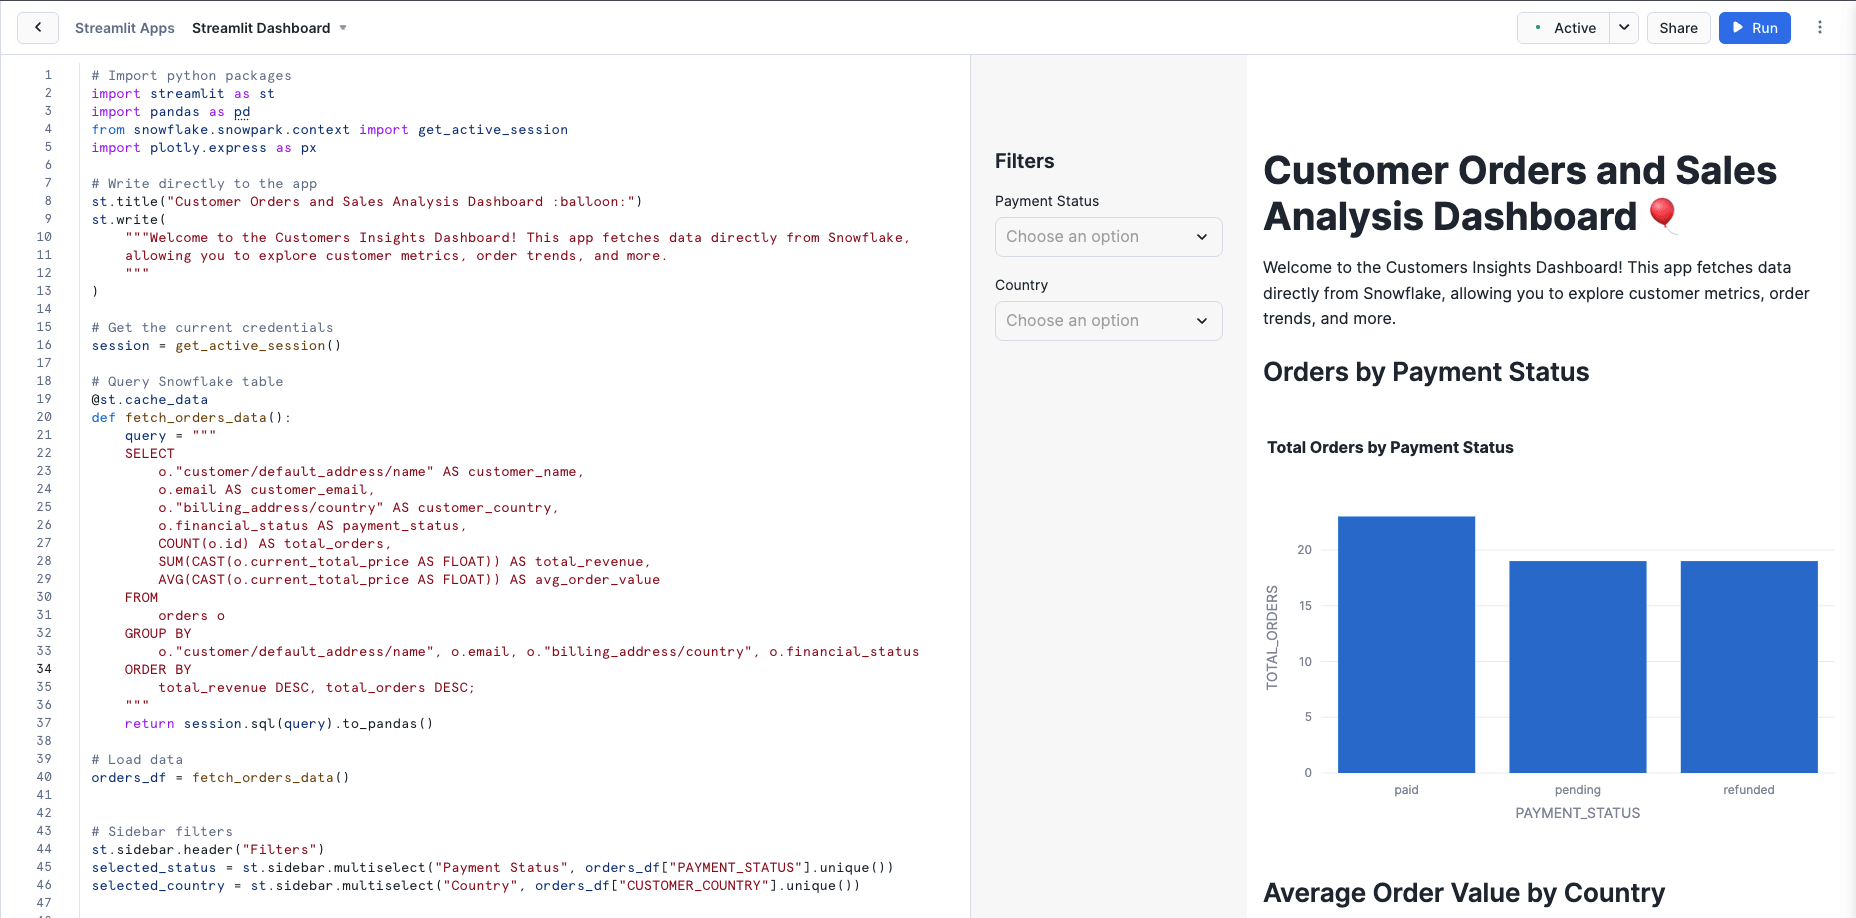
Next, to visualize your queries, we can create a dashboard by creating a Streamlit App.
Write your queries, and import libraries such as pandas, plotly, and snowflake sessions to visualize your queries:
plaintext# Import python packages
import streamlit as st
import pandas as pd
from snowflake.snowpark.context import get_active_session
import plotly.express as px

# Write directly to the app
st.title("Customer Orders and Sales Analysis Dashboard :balloon:")
st.write(
    """Welcome to the Customers Insights Dashboard! This app fetches data directly from Snowflake,
    allowing you to explore customer metrics, order trends, and more.
    """
)

# Get the current credentials
session = get_active_session()
Write a function to fetch customer orders data by payment status.
plaintext@st.cache_data
def fetch_orders_data():
    query = """
    SELECT
        o."customer/default_address/name" AS customer_name,
        o.email AS customer_email,
        o."billing_address/country" AS customer_country,
        o.financial_status AS payment_status,
        COUNT(o.id) AS total_orders,
        SUM(CAST(o.current_total_price AS FLOAT)) AS total_revenue,
        AVG(CAST(o.current_total_price AS FLOAT)) AS avg_order_value
    FROM
        orders o
    GROUP BY
        o."customer/default_address/name", o.email, o."billing_address/country", o.financial_status
    ORDER BY
        total_revenue DESC, total_orders DESC;
    """
    return session.sql(query).to_pandas()

# Load data
orders_df = fetch_orders_data()

# Sidebar filters
st.sidebar.header("Filters")
selected_status = st.sidebar.multiselect("Payment Status", orders_df["PAYMENT_STATUS"].unique())
selected_country = st.sidebar.multiselect("Country", orders_df["CUSTOMER_COUNTRY"].unique())

# Apply filters
filtered_data = orders_df
if selected_status:
    filtered_data = filt
ered_data[filtered_data["PAYMENT_STATUS"].isin(selected_status)]
if selected_country:
    filtered_data = filtered_data[filtered_data["CUSTOMER_COUNTRY"].isin(selected_country)]

# Visualizations
st.subheader("Orders by Payment Status")
status_chart = px.bar(
    filtered_data.groupby("PAYMENT_STATUS")["TOTAL_ORDERS"].sum().reset_index(),
    x="PAYMENT_STATUS",
    y="TOTAL_ORDERS",
    title="Total Orders by Payment Status"
)
st.plotly_chart(status_chart)

# Average Order Value by Country
st.subheader("Average Order Value by Country")
avg_order_value_country = filtered_data.groupby("CUSTOMER_COUNTRY")["AVG_ORDER_VALUE"].mean().reset_index()

# Display bar chart for average order value
st.bar_chart(avg_order_value_country.set_index("CUSTOMER_COUNTRY"))Output:
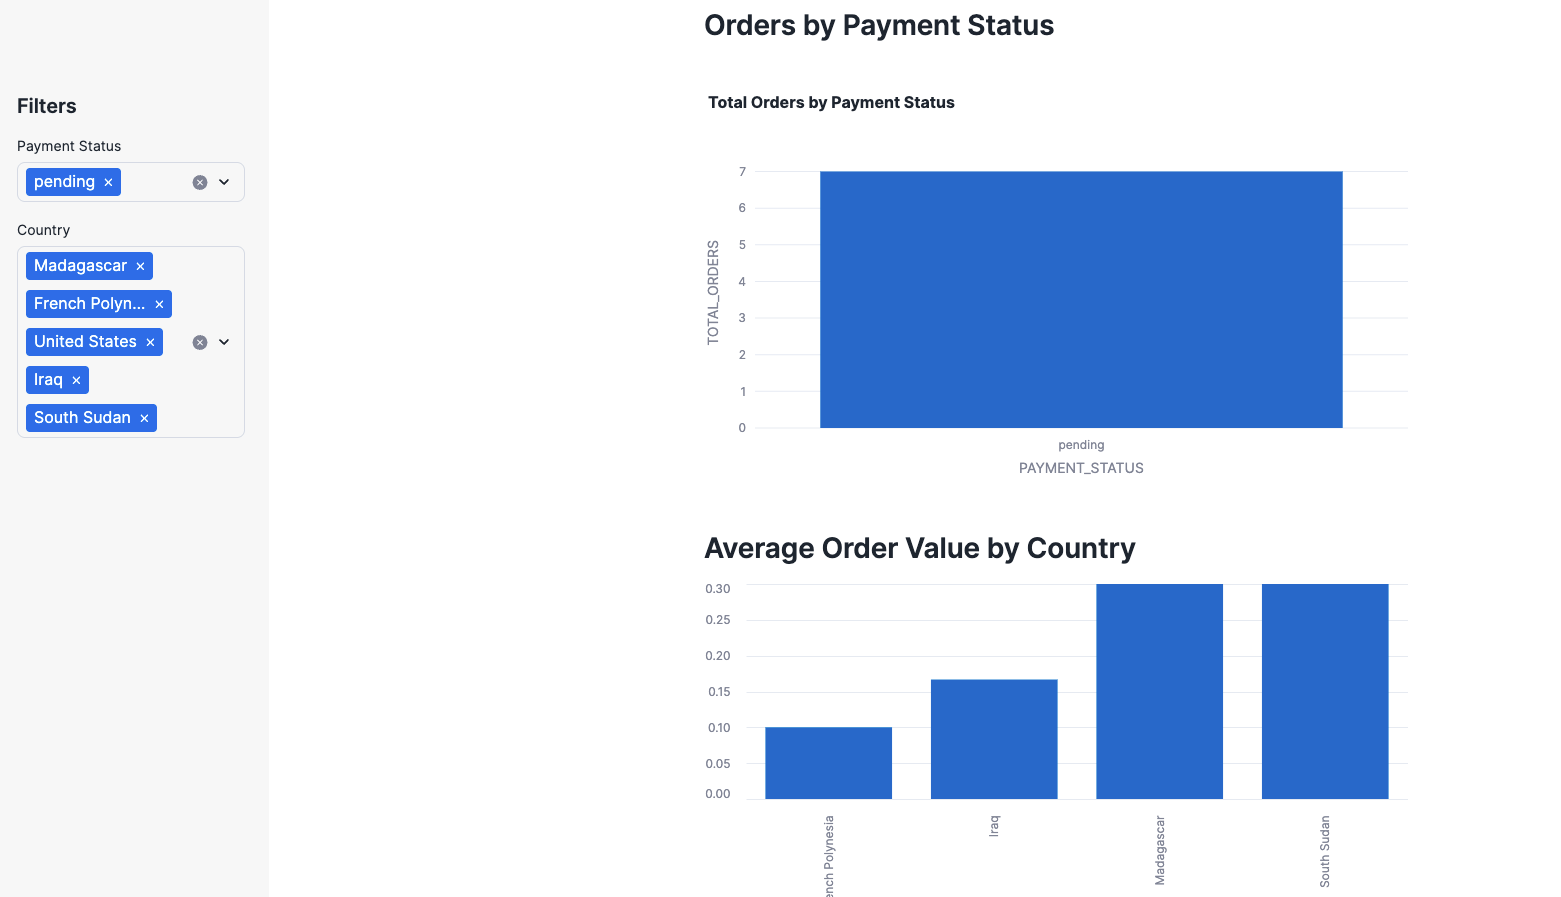
The following output, written for creating a Streamlit-based dashboard, fetches, filters, and visualizes customer orders that you can filter based on the Payment Status and Country. Fetching customer orders based on payment status enhances financial tracking, operational efficiency, and customer experience. When visualized in a dashboard, it provides real-time insights that helps optimize revenue collection, reduce payment failures, and improve customer retention strategies.
Here, you can filter the results by Payment Status and Country.
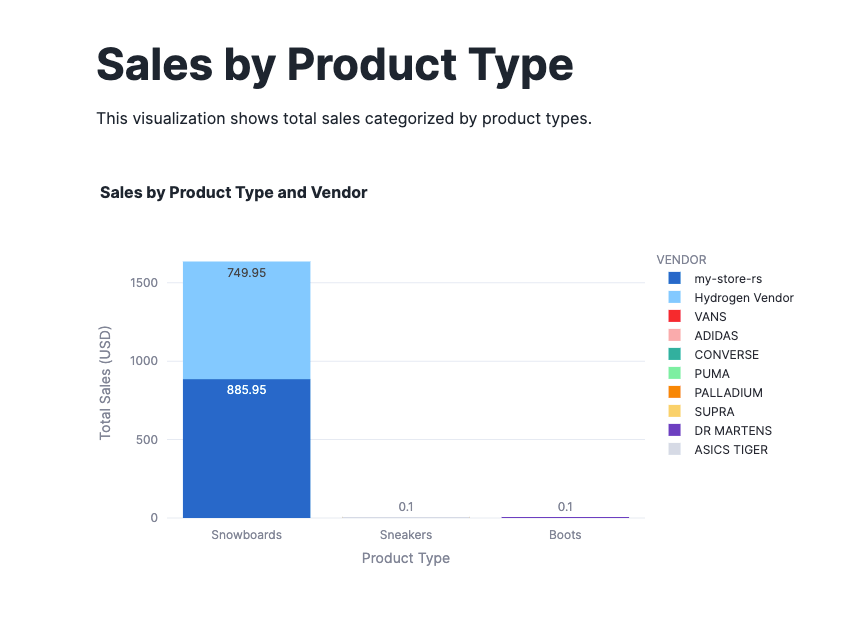
Creating Sales by Product Type:
plaintextdef fetch_sales_by_product_type():
    query = """
    SELECT
        l.value:"vendor"::STRING AS vendor,
        CASE
            WHEN l.value:"title" ILIKE '%Snowboard%' THEN 'Snowboards'
            WHEN l.value:"title" ILIKE '%Dr Martens%' THEN 'Boots'
            ELSE 'Sneakers'
        END AS product_type,
        SUM(l.value:"price"::FLOAT * l.value:"quantity"::INT) AS total_sales
    FROM
        orders o,
        LATERAL FLATTEN(input => o.line_items) l
    WHERE
        l.value:"product_exists" = TRUE
    GROUP BY
        l.value:"vendor",
        product_type
    ORDER BY
        total_sales DESC;
    """
    return session.sql(query).to_pandas()

product_sales_df = fetch_sales_by_product_type()

# Visualization
st.title("Sales by Product Type")
st.write("This visualization shows total sales categorized by product types.")

fig = px.bar(
    product_sales_df,
    x="PRODUCT_TYPE",
    y="TOTAL_SALES",
    color="VENDOR",
    title="Sales by Product Type and Vendor",
    labels={"TOTAL_SALES": "Total Sales (USD)", "PRODUCT_TYPE": "Product Type"},
    text_auto=True
)
st.plotly_chart(fig)Output:
Sales by Product Type: The following visualization of Sales By Product Type, with different vendors distinguished by color, provides a clear breakdown of how different suppliers in your business contribute to sales within each product category. This visualization is particularly useful for sales strategy and vendor performance analysis.
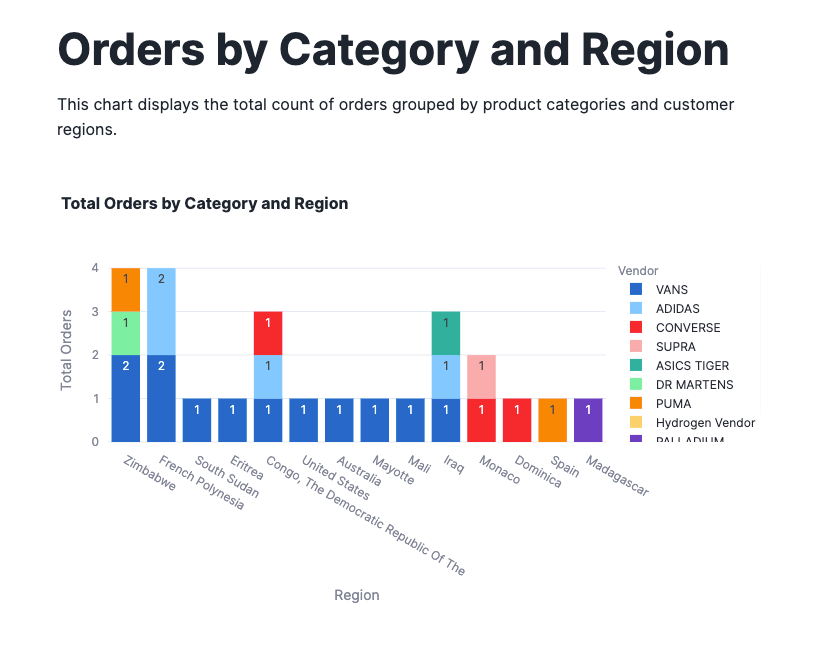
Orders by Product Category and Region: By looking at the total customer orders sold by geographic regions and product categories, you can analyze sales performance across product categories and gain insights into regional demands and category preferences.
Conclusion
By integrating Shopify data into Snowflake using Estuary and visualizing insights in Streamlit, the data synchronization process is simplified and automated, making it both efficient and scalable. Leveraging data from a Shopify store integrated with Snowflake, the dashboard provides detailed visualizations and metrics to track customer orders, sales trends, product performance, and regional demand.
This dashboard is especially valuable for e-commerce store owners and sales and marketing teams. It provides them with actionable insights to improve operations, target specific regions, enhance vendor collaborations, and maximize revenue. Its real-time data capabilities ensure that decision-makers always have access to the most up-to-date information, enabling agility in an increasingly competitive online marketplace.
In addition to leveraging customer transaction data, you can integrate marketing campaign data from platforms like Google Ads or Facebook Ads into your Shopify store, along with Web Pixel App extensions (such as Meta Pixel). This integration allows you to analyze the effectiveness of your advertising efforts and track user actions on your site, such as visiting pages or adding items to their cart. By optimizing your marketing campaigns based on these insights, you can significantly increase your return on investment (ROI).
Get Started Today!
Take your Shopify sales analytics to the next level by integrating it with Snowflake using Estuary Flow. Sign up for Estuary Flow today and start effortlessly building your real-time, data-driven insights!

About the author
Ruhee has a background in Computer Science and Economics and has worked as a Data Engineer for SaaS providing tech startups, where she has automated ETL processes using cutting-edge technologies and migrated data infrastructures to the cloud with AWS/Azure services. She is currently pursuing a Master’s in Business Analytics with a focus on Operations and AI at Worcester Polytechnic Institute.

