The customer is always right, or at least they always have an opinion. Feedback is important for any company looking to improve their products and meet the needs of their customers, but it’s easy to get lost in the weeds of specific responses. What if a company wanted to take a long view on their surveys? They could track the number of survey responses over time, perhaps correlating peak response times with new features or marketing pushes.
Better yet, they could track survey sentiment over time, analyzing general increases and dips in sentiment.
In this tutorial, we’ll build a basic survey form-to-data warehouse pipeline in Estuary and then use Estuary data transformations to perform sentiment analysis, assigning a sentiment score to survey data.
Prerequisites
To follow along with this tutorial, you will need:
- A Google account
- An Estuary account
- A MongoDB account
- Estuary flowctl installed
Free versions are available for all of these resources.
Step 1: Survey Form Creation
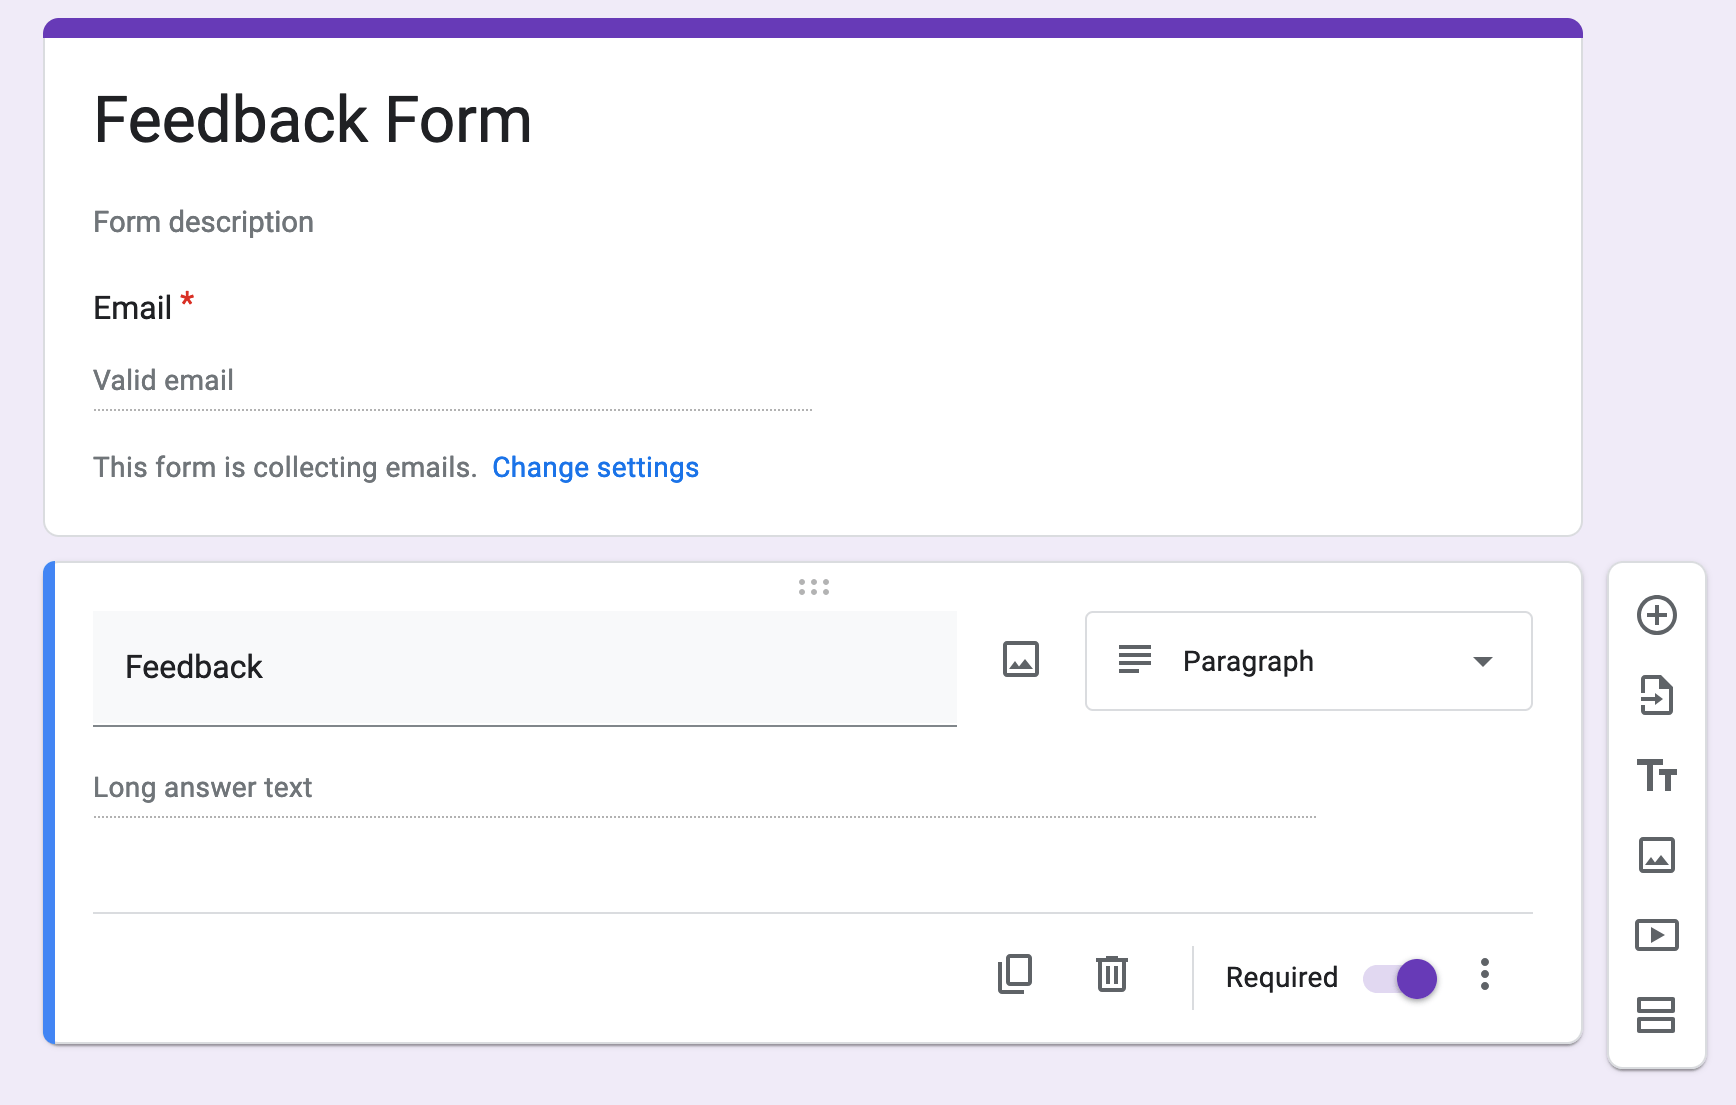
To get our data source going, before we even look at our Estuary dashboard, let’s create a new Google Form with an attached Google Sheet. In your Google account, go to your Drive and select New -> Google Forms.
You can create any kind of survey you like, though note that this will affect your Estuary schema later. To keep things simple, my form only requires a paragraph-type Feedback response. Under Settings -> Responses, I also chose to collect email addresses based on responder input.
To save incoming responses to a spreadsheet:
- Navigate to the Responses tab
- Select Link to Sheets
- Ensure Create a New Spreadsheet is selected
- Click Create
- Select View in Sheets, which will replace the Link to Sheets button
- From the Share dropdown in the sheet, select Copy Link for later
Step 2: Connect Google Sheet to Estuary for Data Capture
Now that your Google Form is ready to take responses, let’s link it to Estuary so that we can easily propagate our survey data to storage later.
In the Estuary dashboard:
- Navigate to the Sources tab
- Click the New Capture button
- From the list of source connectors, select Google Sheets Incremental
- Provide a name for the capture, such as “surveys”
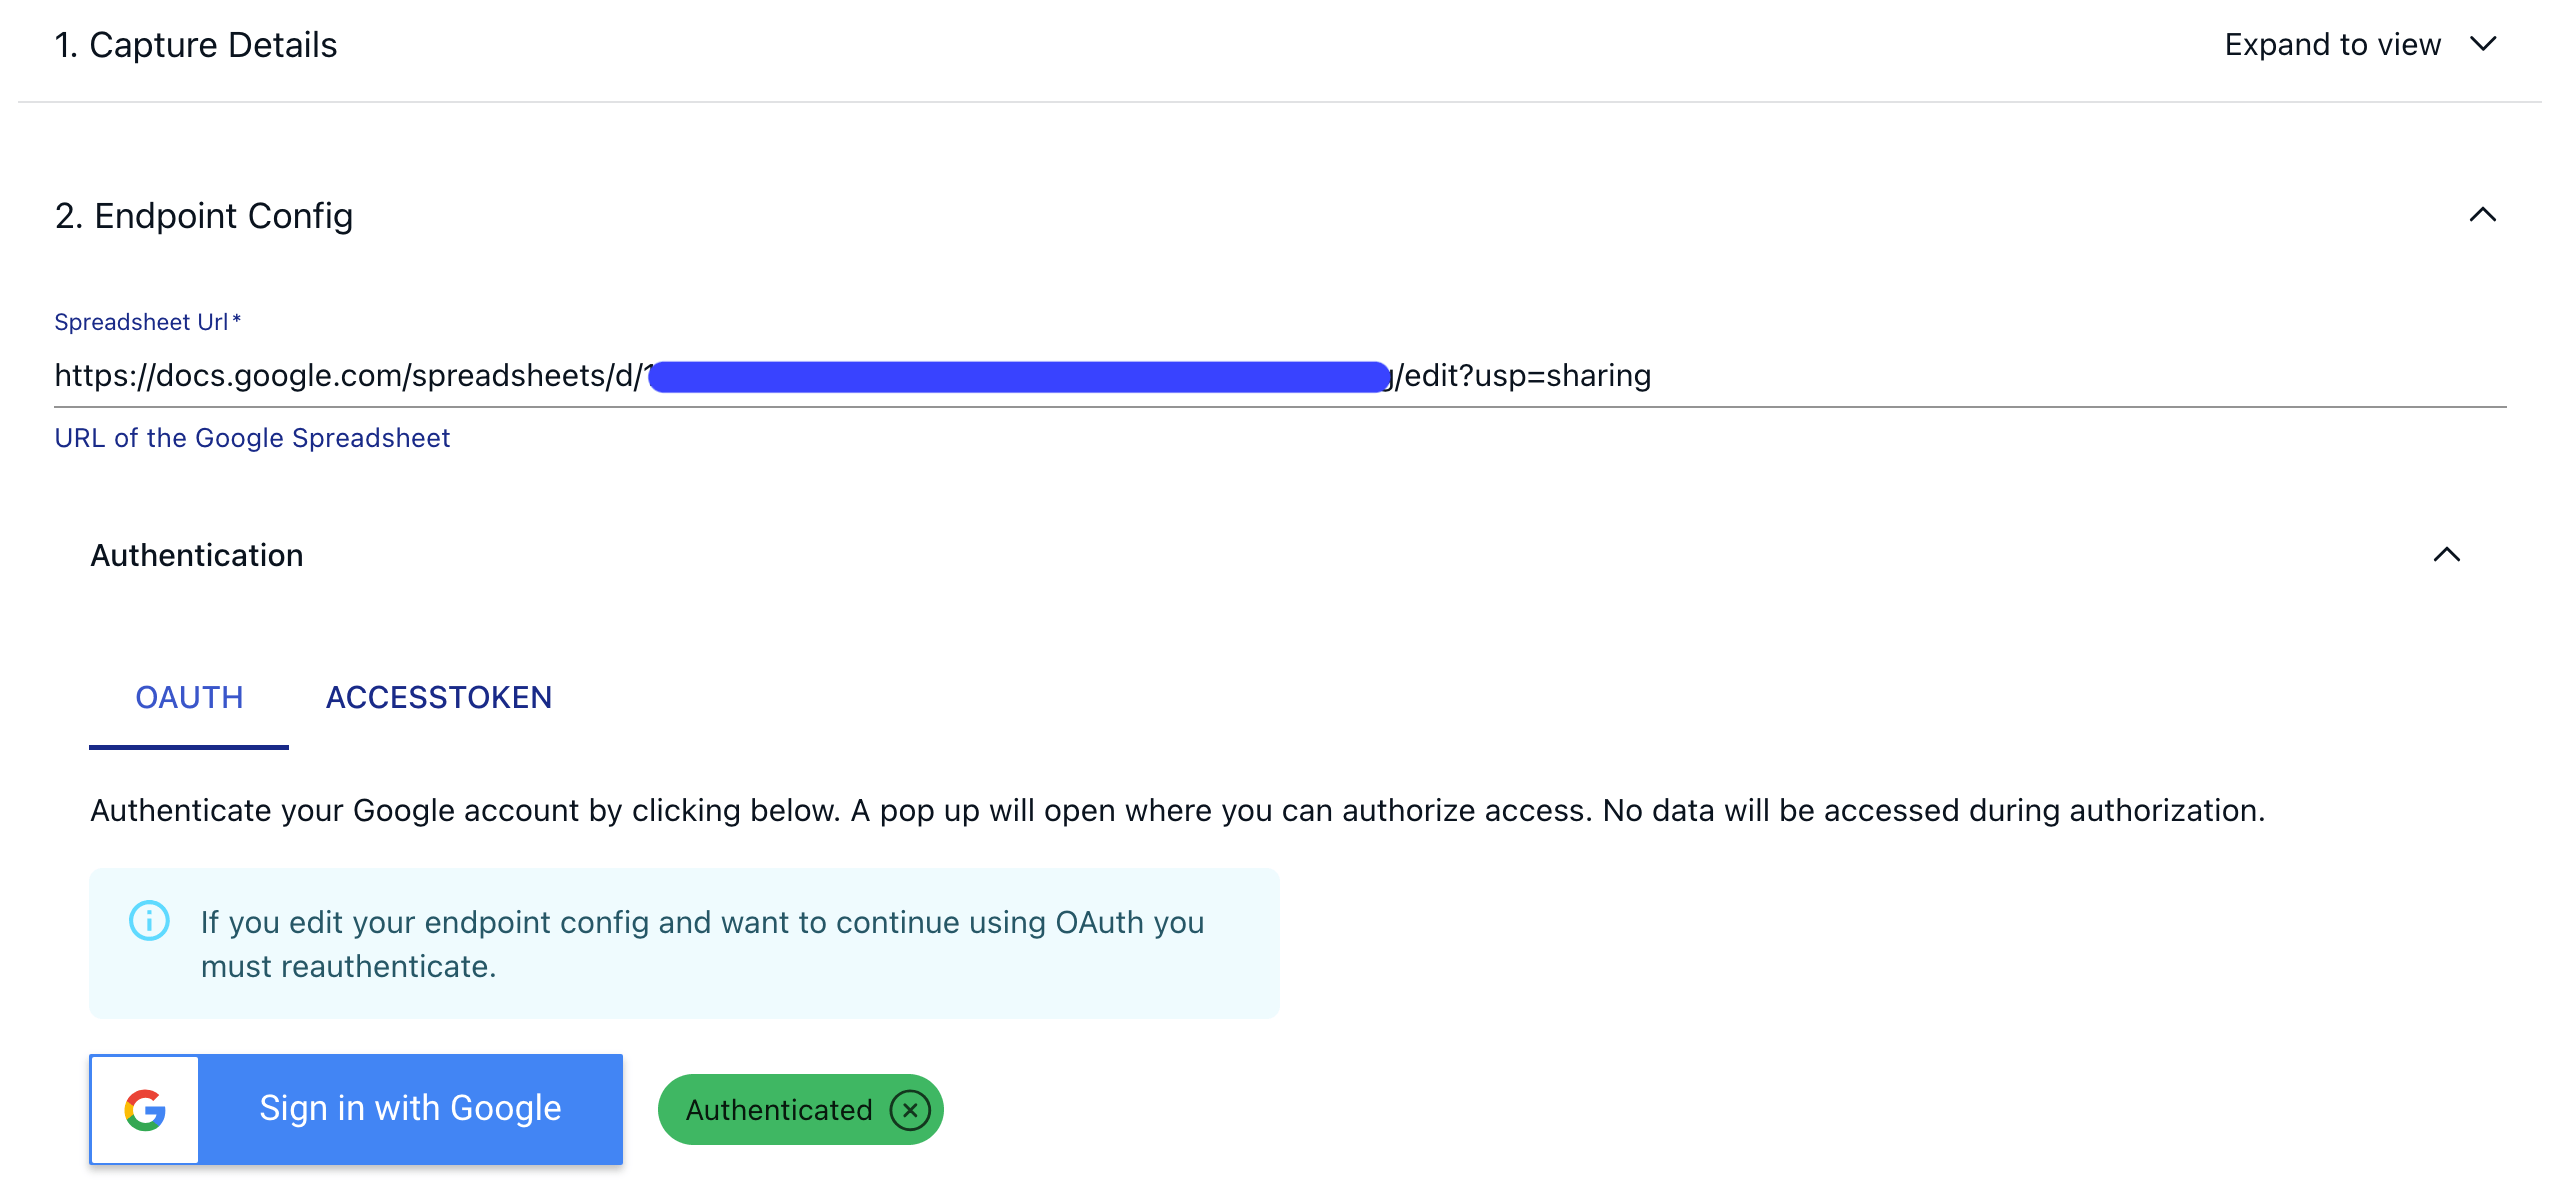
- Paste the link to your Google Sheet into the Spreadsheet URL field
- Authenticate access to your Google data
Some additional configuration is presented for specific schema management, but for our purposes, the defaults are fine. Select Save and Publish to finish connecting your Google Sheet to Estuary.
Now, any new form responses will not only populate to the spreadsheet, but also Estuary! You can navigate to the auto-generated Estuary Collection to preview the data that Estuary’s receiving.
For more on Estuary’s Google Sheets connector or if you run into any issues connecting, see Estuary’s documentation.
Step 3: Survey Data Storage in MongoDB
We can’t stop there. We eventually want our survey responses to be saved to a data warehouse for later analysis and perusal, so we’ll also need to create an Estuary Destination.
Why Use MongoDB for Survey Data?
Any number of databases could be good options for our store. In this instance, we’ll use document-based storage like MongoDB. Since we’re working with survey data, there’s a high likelihood we’ll want to eventually update our survey or send out different versions. In this case, a relational database would be very rigid: we don’t really want to create new columns for every permutation of survey fields we use.
For simplicity in this tutorial, we’ll assume a functional and already-set-up MongoDB account and a database hosted directly with MongoDB. If you’re completely new to MongoDB, do note that MongoDB offers an excellent free tier to test out. In either case, if you run into any trouble along the way, this tutorial explains connecting Estuary with MongoDB in far more depth.
Steps to Configure MongoDB in Estuary
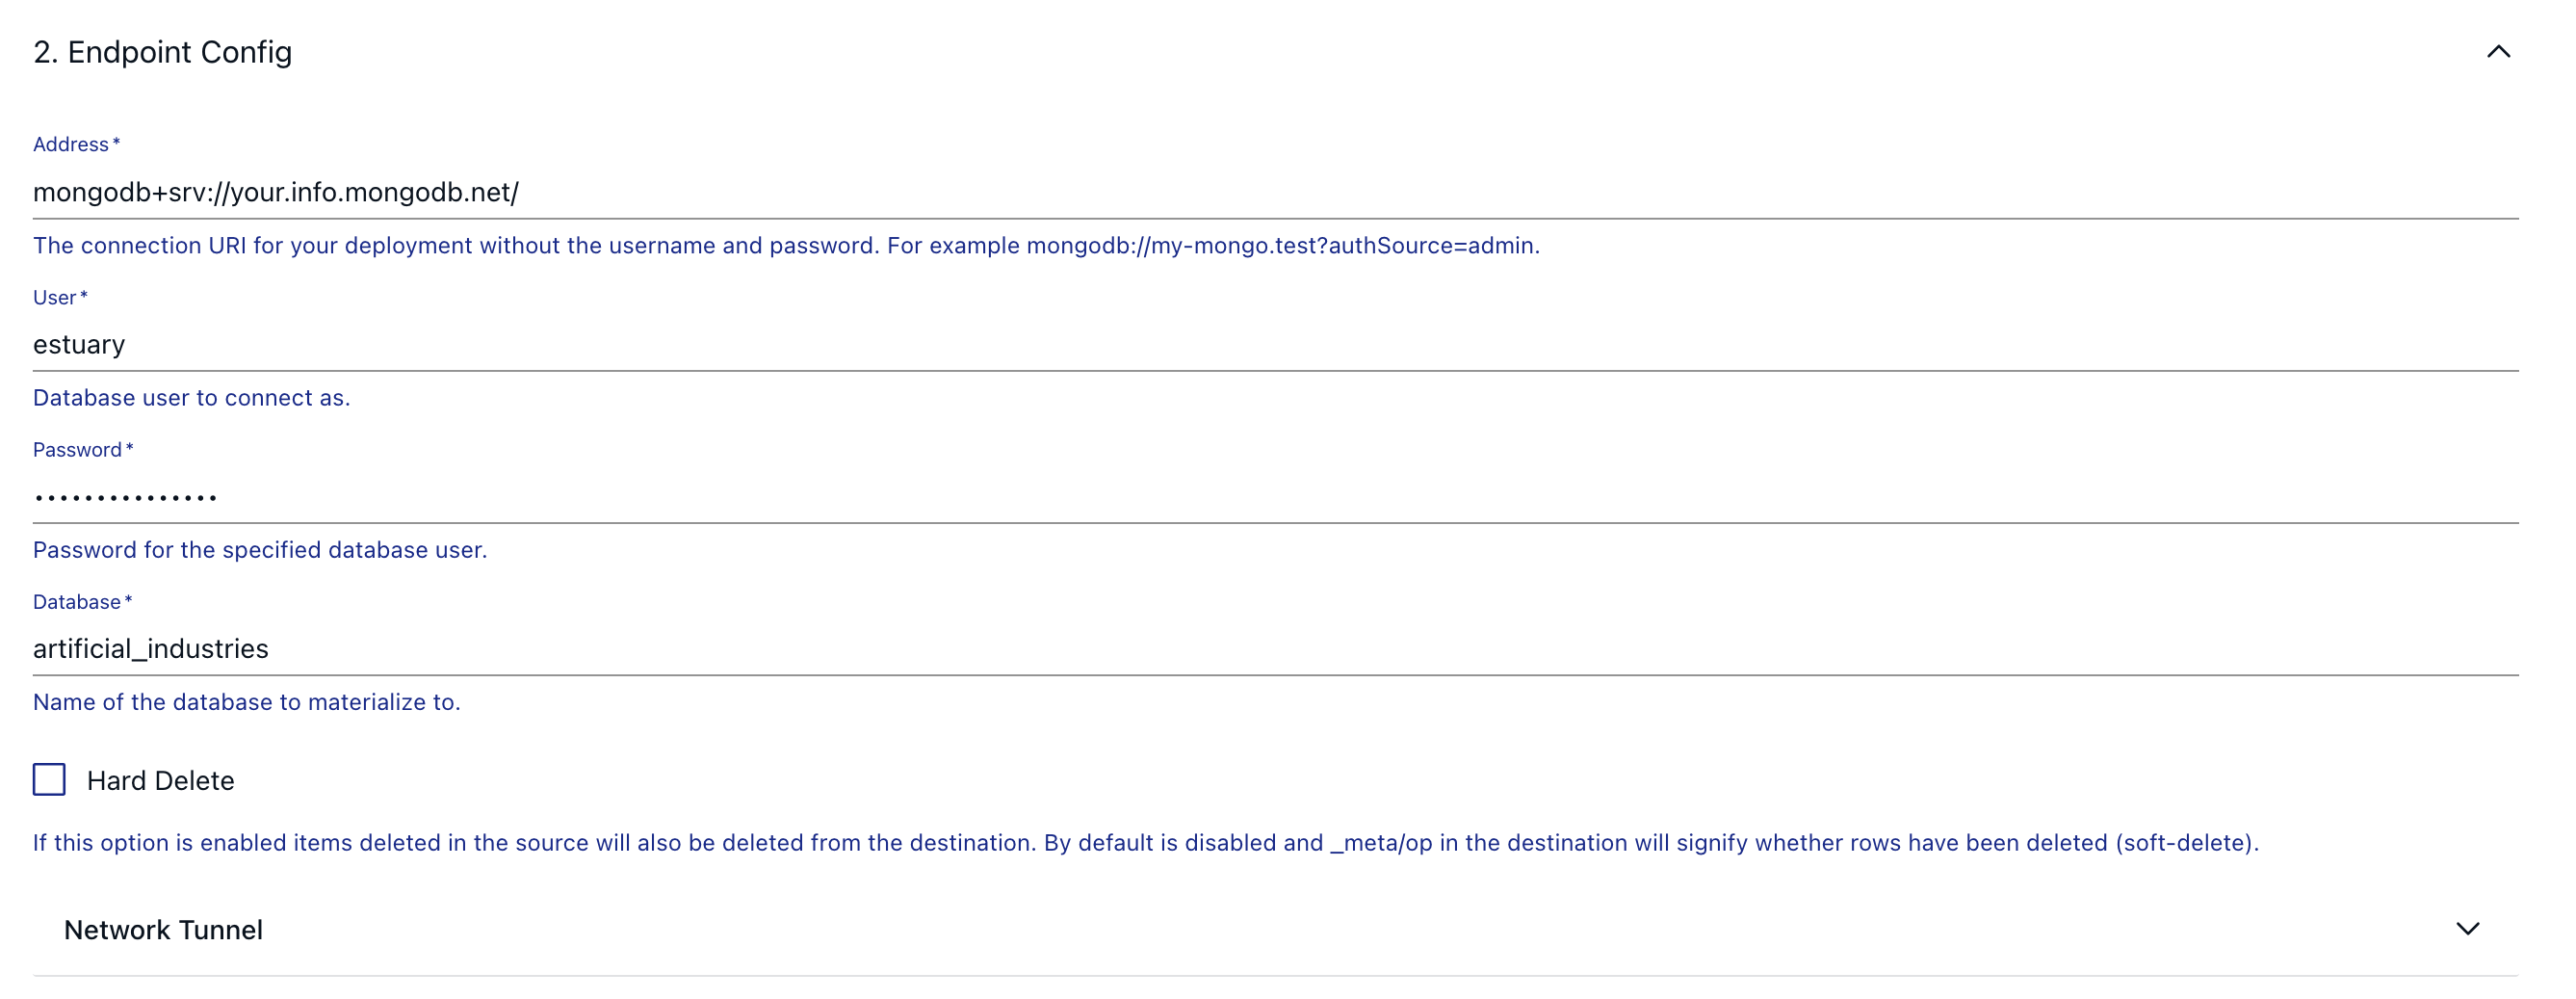
So, in the Estuary dashboard, once you’ve selected MongoDB as your New Materialization, let’s examine the Endpoint Config section. This is where we’ll do the main work of integrating the two systems.
Address: If you’re hosting your database with MongoDB, you can retrieve this information by choosing a new connection method. Choose a CLI connection. Instead of completing the MongoDB connection instructions, find the server address MongoDB lists in the provided CLI commands. This should be something like mongodb+srv://your.info.mongodb.net/.
User and password: Estuary will use a service account to access your database. You can create a new database user on the Database Access page. Make sure to copy the username and password information to Estuary. For the user role, select at least read and write privileges, as Estuary will be writing our survey data to MongoDB.
Database: The hard part is done: this is simply the name of your database.
All that’s left in Estuary is to choose a data source. Select your survey data, along with the auto-generated collection. We’ll update this later when we transform our data.
Save and publish your materialization.
Besides the setup in the Estuary dashboard, you’ll also need to tweak one final configuration on the MongoDB side. While you were creating a user earlier, you may have noticed a Network Access page below Database Access. By default, MongoDB will only allow your current IP to connect to your cluster. To let Estuary write data for you, add Estuary’s IPs to the allowlist.
With that, you’ve completed a basic data pipeline with Estuary! Without worrying about learning custom APIs or building your own services to transfer data, you now have a process that automatically picks up new events as they occur and stores them.
Even with what we’ve built so far, you could perform some data analysis around feedback frequency and peak response times. But we’re not done yet. Let’s explore data transformation within the Estuary system.
Step 4: Associating Sentiment Data with Survey Results
We’ve looked at Estuary Sources and Destinations, but haven’t spent much time yet with Collections. This step is where we can combine, collate, and remix our data before sending it off to storage. Estuary allows you to use SQL or TypeScript to transform your data, including making use of existing TypeScript libraries–which is exactly what we’re going to do to add sentiment analysis to our survey data.
It’s time to break out a little code.
Setup: Preparing Your Development Environment
This tutorial assumes you have Estuary’s flowctl CLI command locally, but you can also manage derivations using GitPod.
To generate files locally to start your derivation:
- Navigate to your preferred development directory in the terminal
- Run flowctl auth login
- This will open a new browser window where you can log into your Estuary dashboard
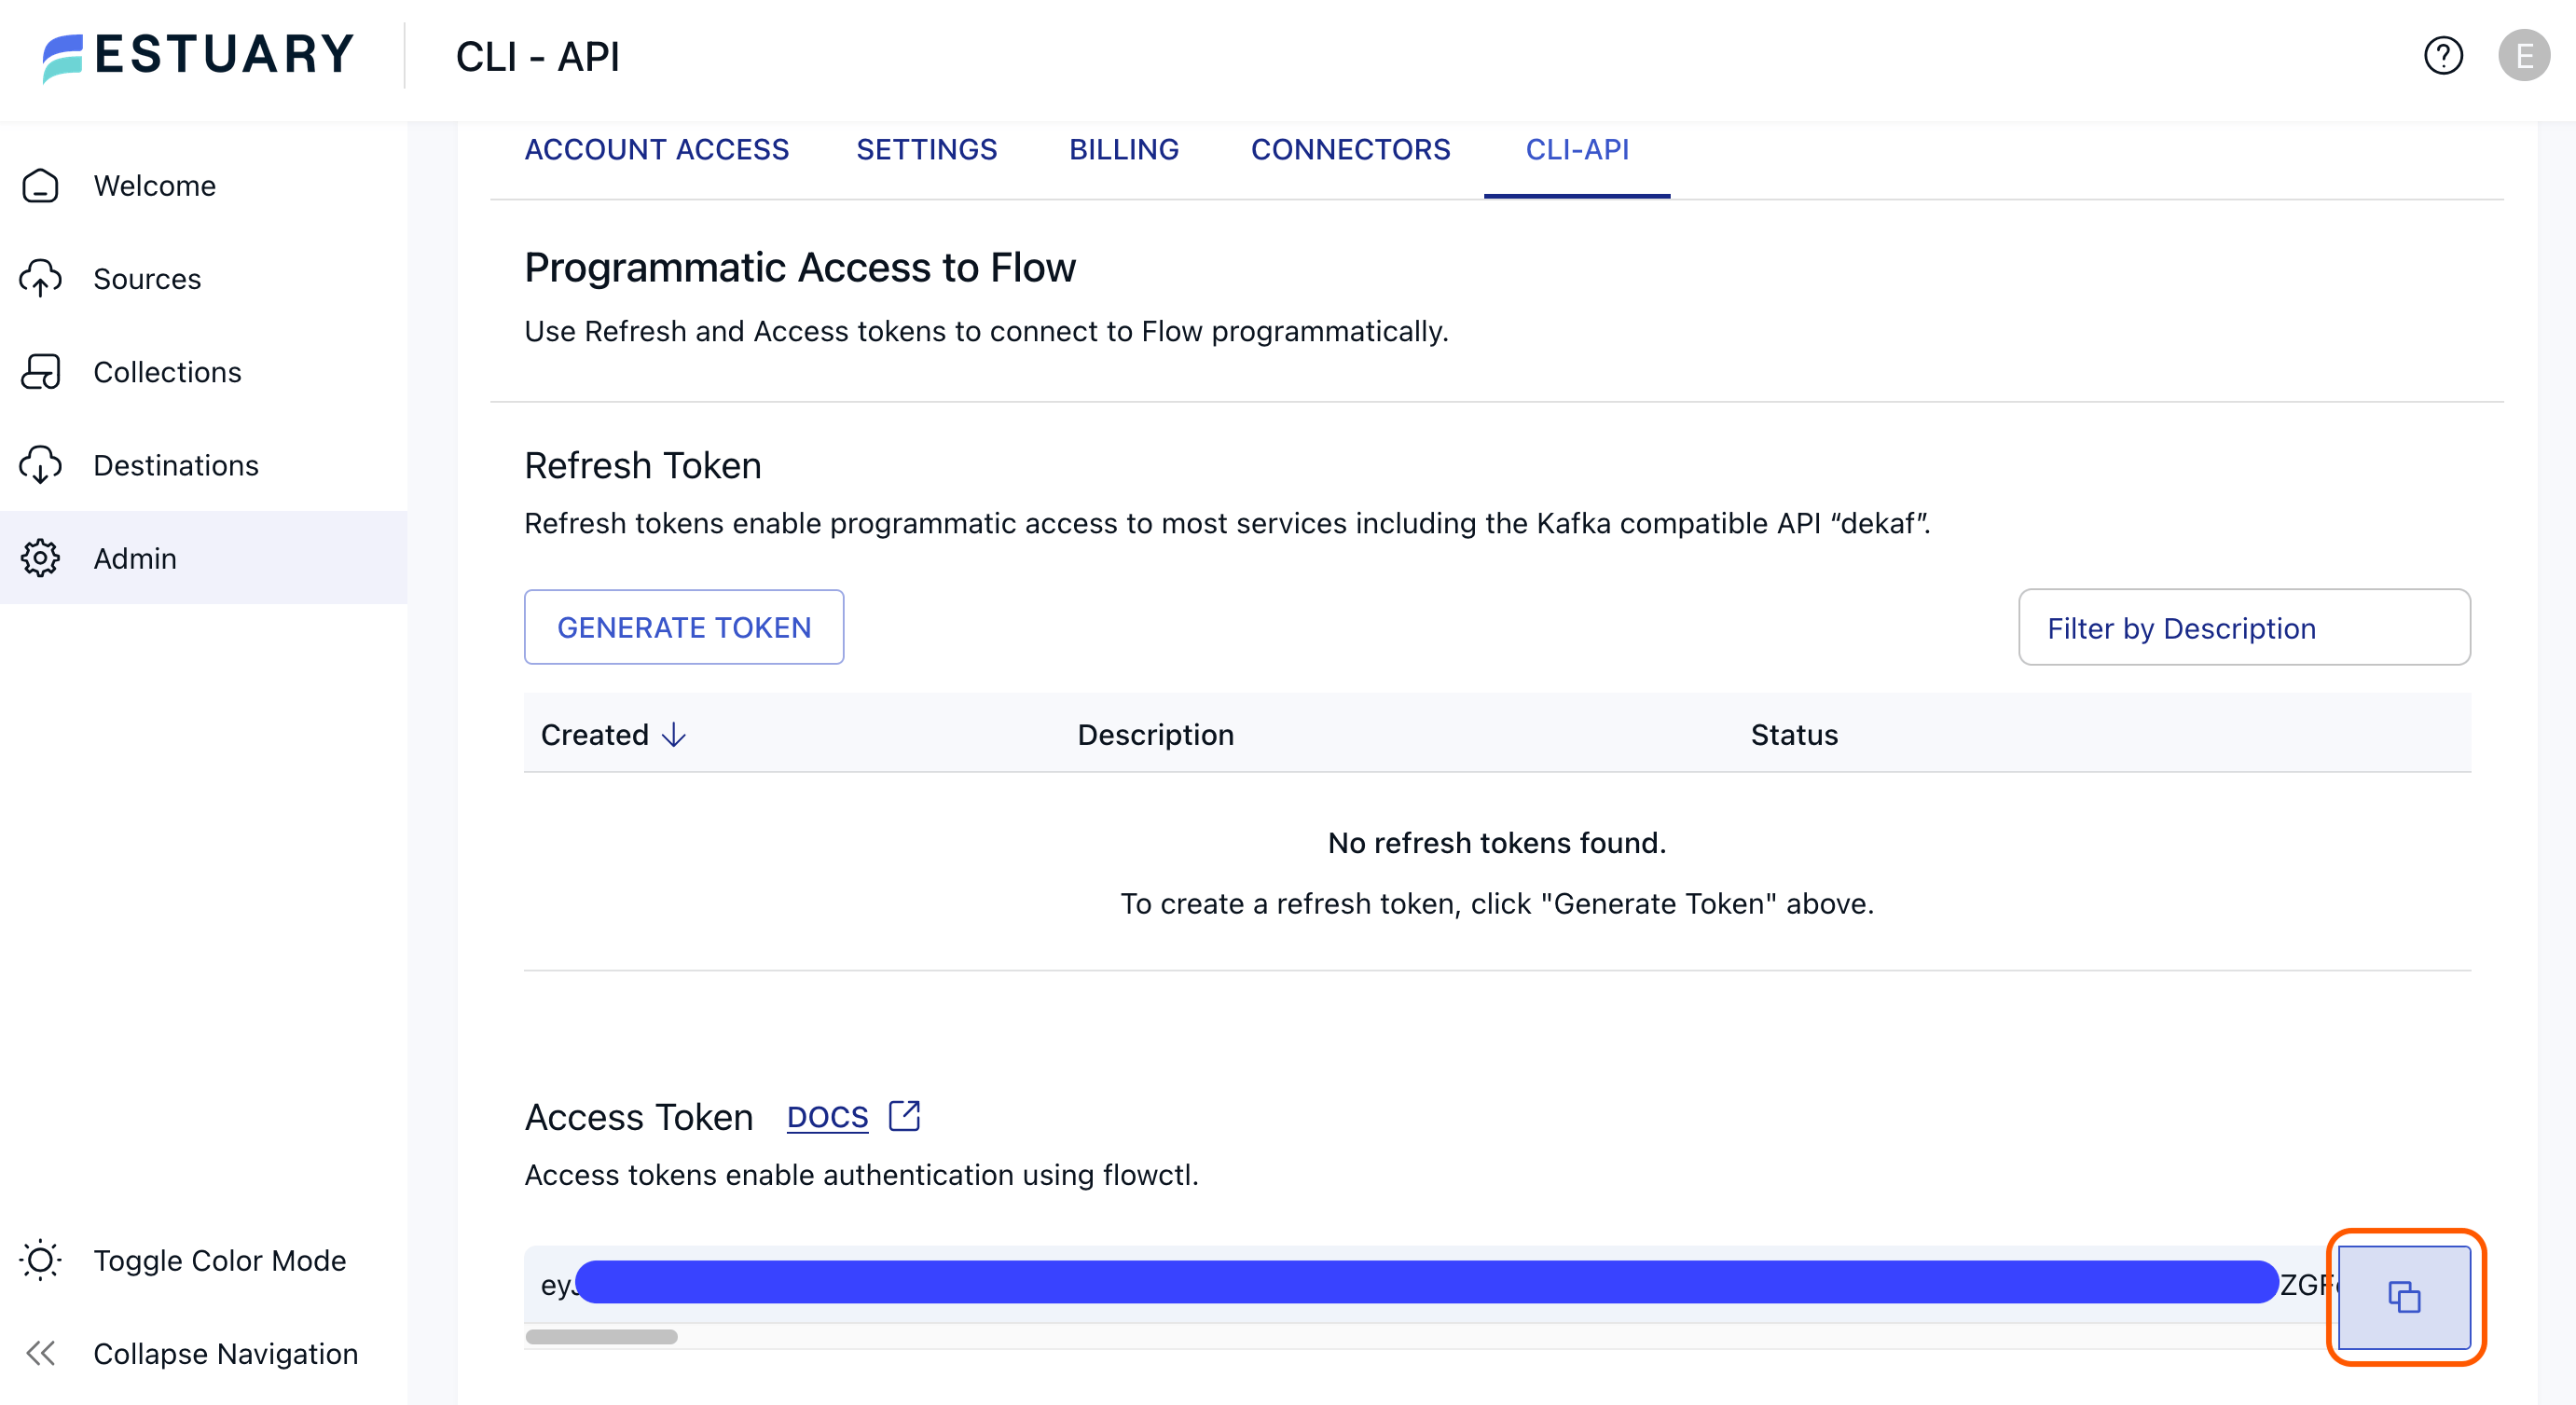
- Once logged in, you are directed to the CLI - API page where you can copy a generated authentication token
- Paste this token into the terminal to authenticate your session
- Run flowctl catalog list --collections to view your available starting collections
- Run flowctl catalog pull-specs --name your/survey/collection, replacing the path with your own
This will pull the collection specifications locally for you to edit. Open up the directory in your favorite editor to take a peek.
Creating a New Collection Schema
You may first be struck by the number of flow.yaml files, one for each subdirectory. We’re looking for the very lowest-level, nested flow.yaml file: this will contain our collection schema.
We want to create a new collection based off of our existing one. It’ll have a similar schema, but add a new field—Sentiment—since we want to attach sentiment analysis results to each piece of feedback we receive.
Add a new collection schema in your flow.yaml file under the existing collection schema. It should look something like this, depending on the questions you included in your initial survey form:
plaintext Artificial_Industries/surveys/processed_surveys:
   schema:
     type: object
     properties:
       Email Address:
         type: string
       Feedback:
         type: string
       Timestamp:
         format: date-time
         type: string
       Sentiment:
         type: number
       _meta:
         properties:
           row_id:
             type: integer
   key:
     - /_meta/row_id
   derive:
     using:
       typescript:
         module: process-surveys.ts
     transforms:
       - name: fromSurveys
         source:
           name: Artificial_Industries/surveys/Form_Responses_1
         shuffle: any
Besides the schema (including the Sentiment field) and key, note the derive field. We’re going to derive this schema using an as-yet-uncreated TypeScript module, in this case called process-surveys.ts. This derivation transforms data, the source being your original collection.
Save your file and run flowctl generate --source flow.yaml. This command will pick up your schema changes and create some stub files for you, including that TypeScript module the schema mentions.
Implementing Sentiment Analysis Using TypeScript
Open up the new TypeScript file in the same directory as your schema. It should currently export a class that simply throws a “Not implemented” error. We want to replace it with something that looks more like this. Let’s go through the code step by step.
typescriptimport { IDerivation, Document, SourceFromSurveys } from 'flow/Artificial_Industries/surveys/processed_surveys.ts';
// @deno-types="npm:@types/sentiment"
import Sentiment from 'npm:sentiment';


// Implementation for derivation Artificial_Industries/surveys/processed_surveys.
export class Derivation extends IDerivation {
   fromSurveys(_read: { doc: SourceFromSurveys }): Document[] {
    // add sentiment analysis to survey results
    const analyzer = new Sentiment();
    const sentimentScore = analyzer.analyze(_read.doc.Feedback).score;

    return [{
        "_meta": {
            "row_id": _read.doc._meta.row_id
        },
        "Email Address": _read.doc['Email Address'],
        "Feedback": _read.doc.Feedback,
        "Timestamp": _read.doc.Timestamp,
        "Sentiment": sentimentScore
    }];
   }
}
In the Derivation class, we want to analyze our survey data for underlying sentiment. To do this, I chose the sentiment NPM package for its simplicity and because it doesn’t require additional dependencies.
Estuary uses deno so to import additional libraries, we should use deno notation. Since sentiment doesn’t include its own types, we should therefore also tell deno to import type data using // @deno-types="npm:@types/sentiment".
Within the fromSurveys method, we can then create a new Sentiment object. The analyze method will take a string: perfect for our Feedback text field from our survey. Note that, to access data from our source collection, we read from _read.doc followed by the field name.
The analysis returns various data that might be useful (you can see an example here), but we’re only interested in the score for now. This will rank the text on a scale of very negative (-5) to highly positive (5), matching our schema’s Sentiment field type of number.
We then return what the updated object should look like. This mostly consists of reiterating our original collection data, using the _read.doc notation, but we also include the Sentiment with our calculated sentimentScore. Again, this will be slightly different if you added different questions to your survey.
Save your changes. Then it’s time to test!
Run flowctl preview --source flow.yaml to check your output. You can also run flowctl catalog test --source flow.yaml to run Estuary’s test cycle.
If everything looks good, go ahead and push your changes back to Estuary with: flowctl catalog publish --source flow.yaml
Step 5: Updating a Materialization
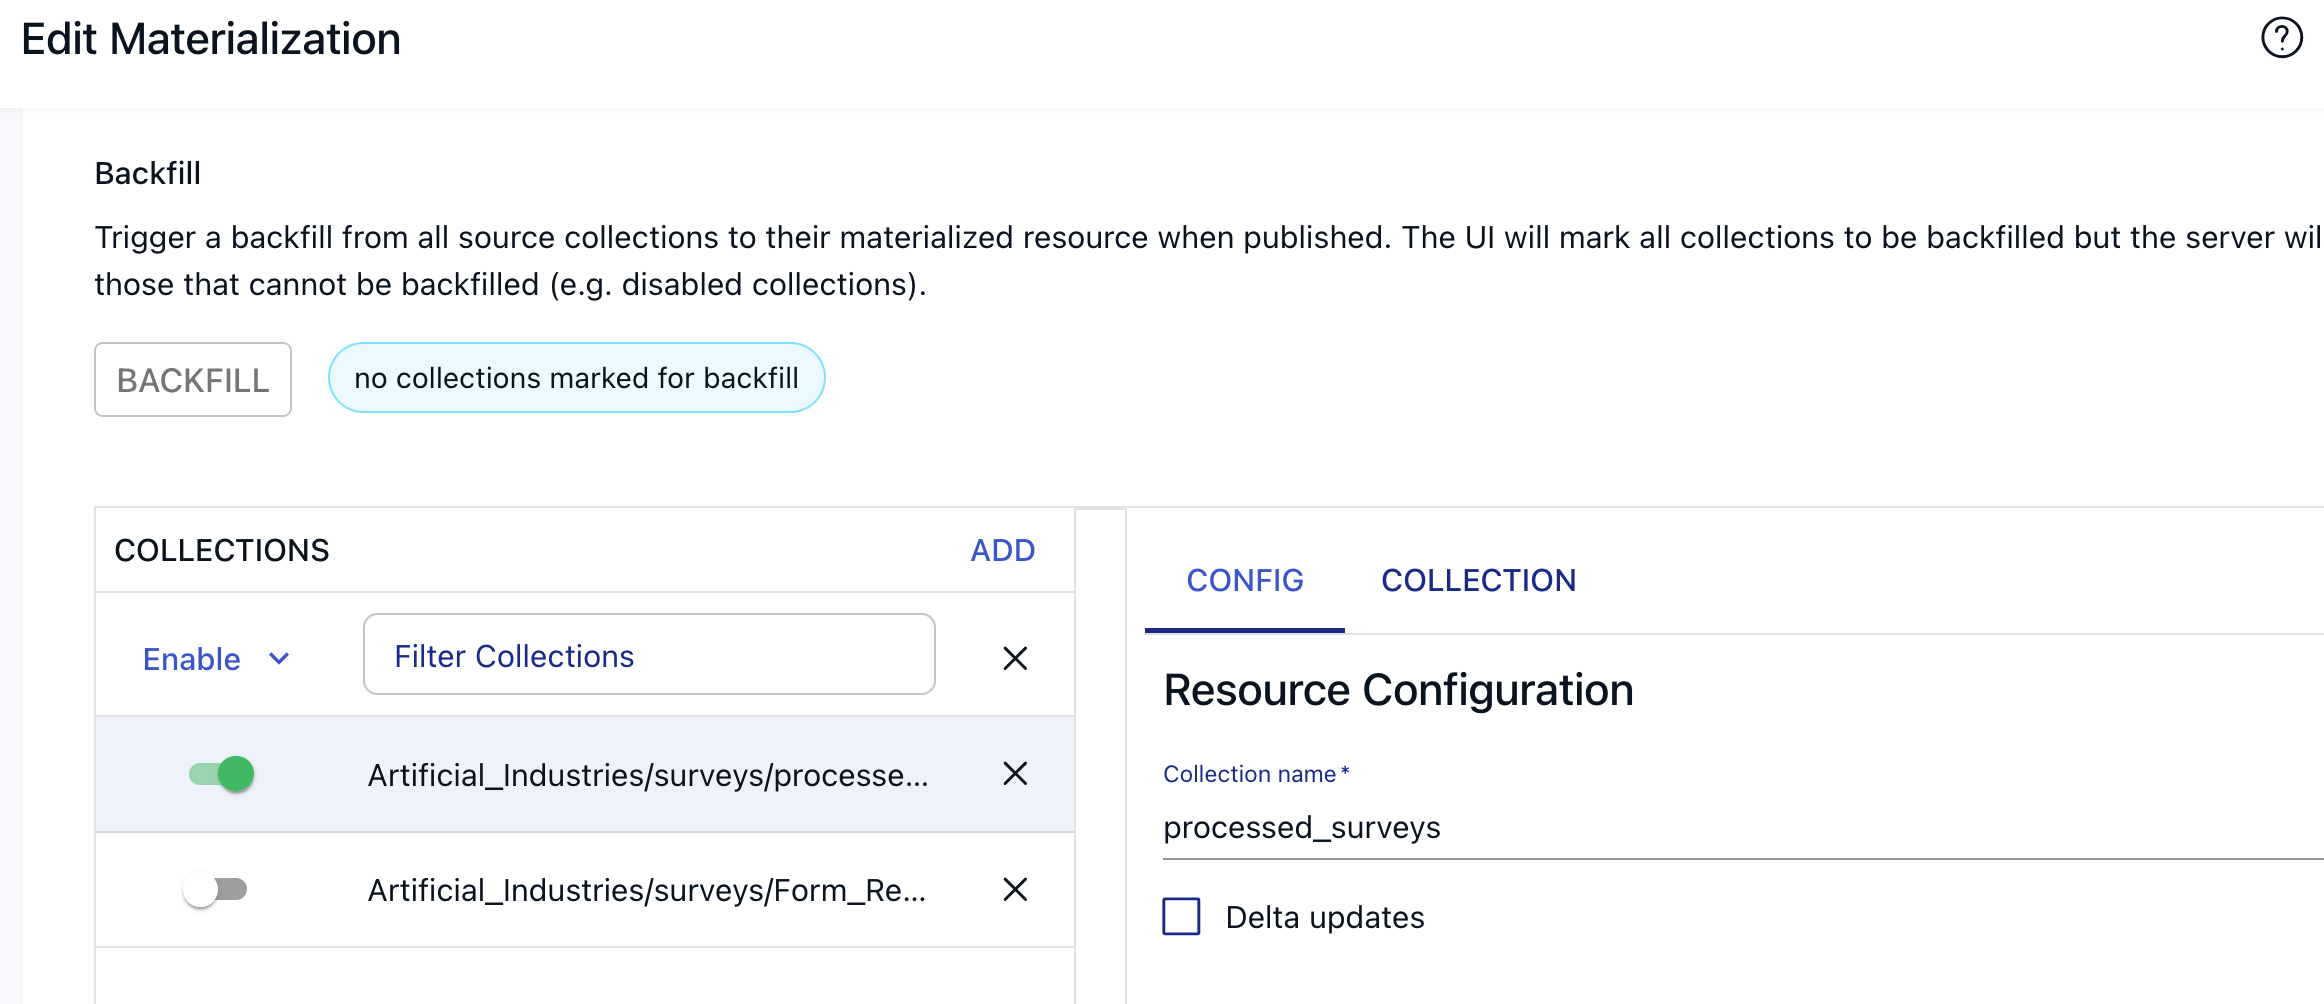
There’s one final step to put your pipeline together. Remember your MongoDB materialization? We set it up to receive data from our original collection for our basic data flow. Now, we want to switch it to our derived collection so MongoDB accesses our transformed data.
- In your Estuary dashboard, under Destinations, find your MongoDB materialization
- Select Edit
- Scroll down to the Source Collections section
- Add the new collection and remove or disable the old one
- Save and publish your changes
What’s Next
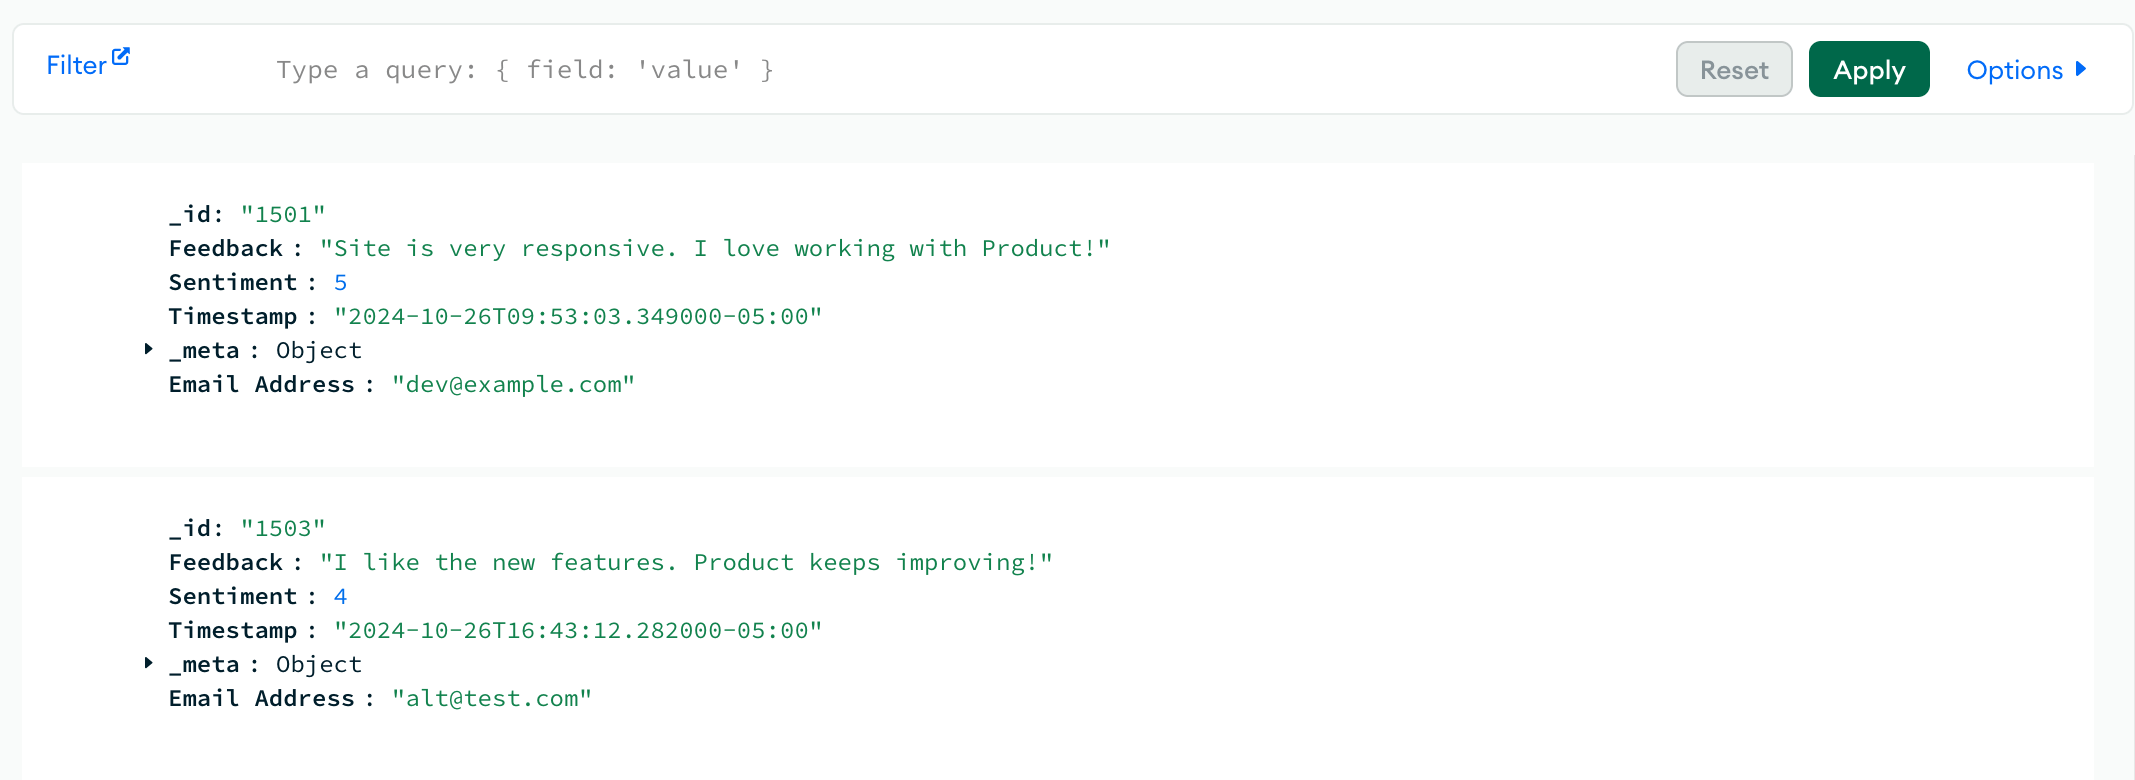
Congratulations! You set up a full ETL pipeline with Estuary, from data extraction, to transformation, to load. Give yourself some feedback in your original form, then follow its journey to MongoDB to see what sentiment analysis has to say about your attitude. Hopefully it’s positive!
Your MongoDB storage would now be ready to provide data if you wanted to review sentiment over time, or even track a specific user’s sentiment over time. This could help inform when features aren’t working or if new policies positively or negatively affect sentiment. It could forewarn user turnover and allow personnel to reach out to fix the issue or gather more details.
Try out more connectors and pipelines with Estuary Flow and see how you can transform your data. For more ideas, check out other Estuary blog posts or tutorials.
We look forward to seeing how you innovate with Estuary!

About the author
Emily is a software engineer and technical content creator with an interest in developer education. She has experience across Developer Relations roles from her FinTech background and is always learning something new.

