One super-common use of real-time data is fraud detection, especially in the financial domain where it's crucial to catch fraud as early as possible. This requires providing access to the latest data for machine learning or statistical models, which has historically been a challenging task.
In this tutorial, you will learn how to build a real-time fraud detection pipeline using Estuary for Change Data Capture (CDC) and Databricks for transaction analysis.
Prerequisites
- An Estuary account: Go ahead and register here, for free.
- An active Databricks account: Databricks offers a free trial that should be enough to follow along with this tutorial.
- Docker: for convenience, we provide a Dockerized development environment so you can get started in just seconds!
What is Change Data Capture?
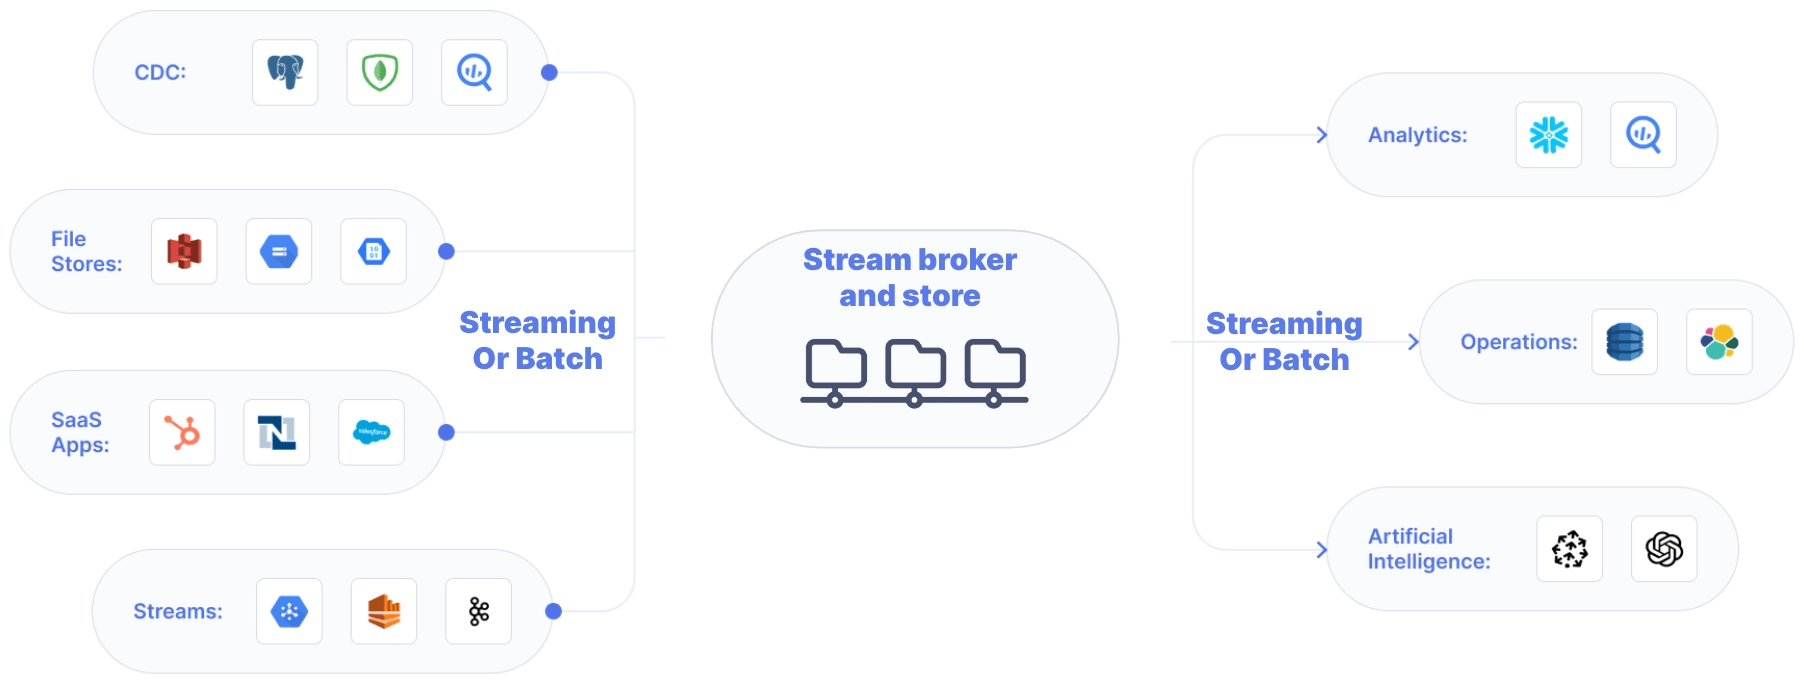
Change Data Capture (CDC) is a method used to track and capture changes made to data in a database. It allows for the real-time capture of insertions, updates, and deletions, creating a continuous stream of changes.
This data stream keeps downstream systems synchronized with the source database. It enables real-time analytics, replication, and data integration. Essentially, CDC allows organizations to capture and react to data changes as they happen, ensuring data accuracy and timeliness across their systems.
If you’re interested, here’s an article with all the intricate details and best practices around CDC.
Step 1: Setting Up the Environment & The Source Database
Head over to GitHub and clone the Estuary examples repository. Change directories into the one called postgresql-cdc-databricks-fraud-detection. This folder contains the data generator script and the docker-compose file for the source database to help speed things along.
Take a look at the docker-compose.yml file and make sure you update the environment variables before spinning up any containers. After you’re done, start the data generator script like this:
plaintextdocker compose upThis will spin up three services:
- Datagen: This is the script that generates transactions every few seconds to simulate a production system.
- PostgreSQL: This is the database the tutorial will use as the source system.
- Ngrok: Ngrok is a handy tool that allows you to expose services to the internet through a temporary address
After a few seconds, look at the logs of the data generator container to verify that records are being inserted into the transactions table.
plaintextdocker logs datagen

Inserted new transaction: (4, datetime.datetime(2024, 3, 3, 15, 37, 0, 924963), 623.07)
Inserted new transaction: (1, datetime.datetime(2024, 3, 20, 17, 14, 12, 240254), 609.46)
Deleted transaction ID 1080
Inserted new transaction: (6, datetime.datetime(2024, 1, 8, 14, 19, 44, 75776), 39.08)
Inserted new transaction: (5, datetime.datetime(2024, 2, 14, 0, 41, 29, 162403), 271.02)
The data generator script is designed to insert, update, and delete records every second to simulate production traffic.
The PostgreSQL database is also seeded with a few test users in a table called users. You’ll be using these two tables as the base for some basic anomaly detection downstream in the data warehouse.
Looks good! The last step is to grab the public URL of the database.
plaintextcurl -s http://localhost:4040/api/tunnels | jq -r '.tunnels[0].public_url'

tcp://5.tcp.eu.ngrok.io:35131
Great, it’s time to start capturing change events. Let’s move on to the next step, which is setting up Estuary to capture changes to these two tables.
Step 2: Set Up Real-Time CDC with Estuary
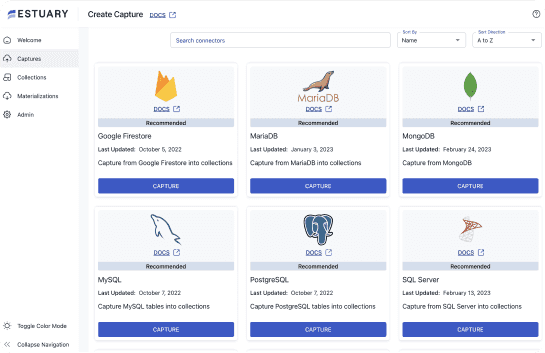
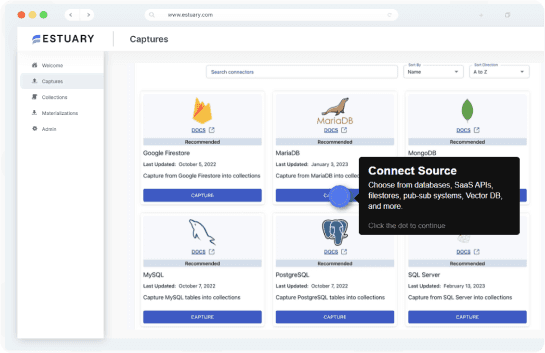
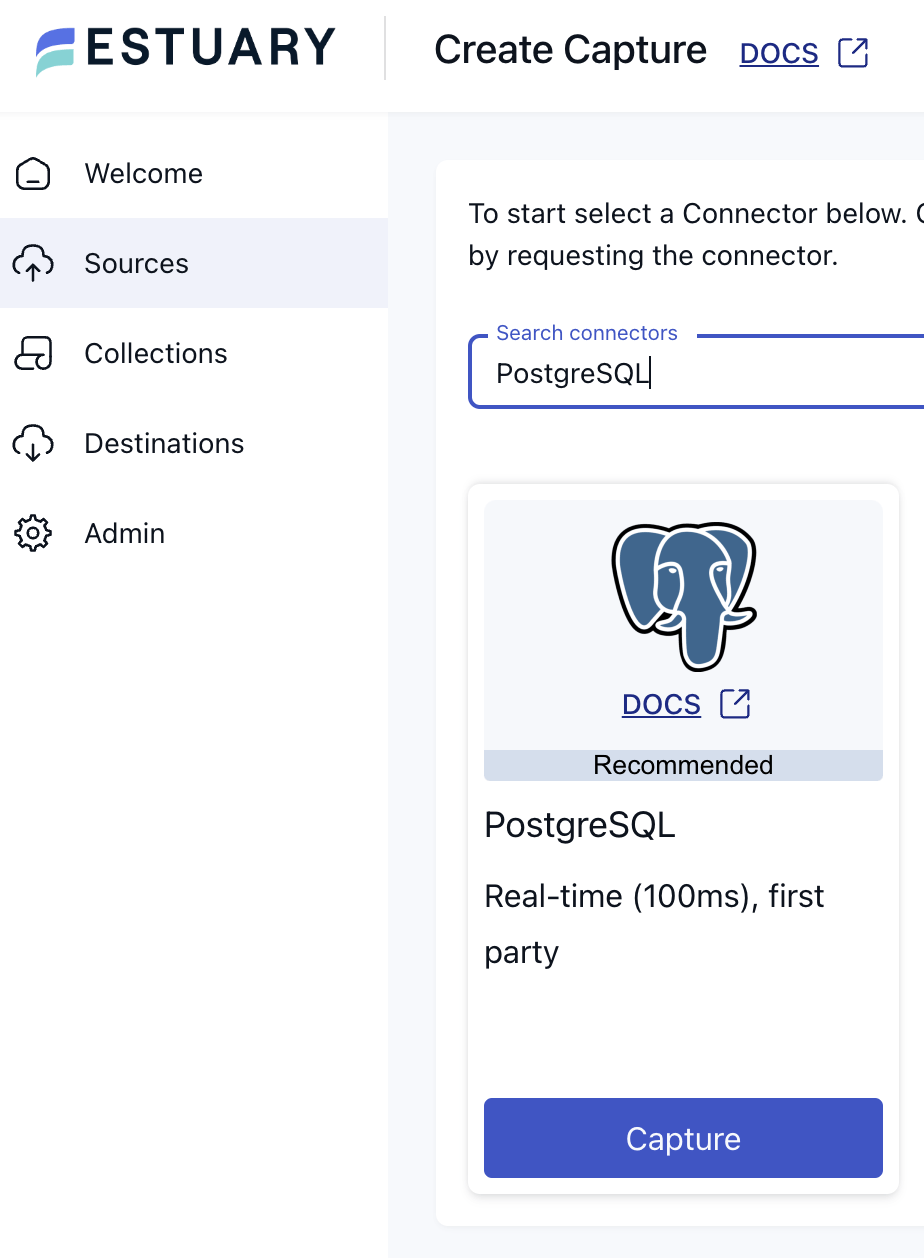
Head over to the Estuary dashboard and create a new PostgreSQL capture.
During the endpoint configuration, use the URL from the previous step and for the user/password combination, the PostgreSQL container is configured as postgres/postgres. After pressing next, in the following section, you can configure how our incoming data should be represented in Flow as collections.
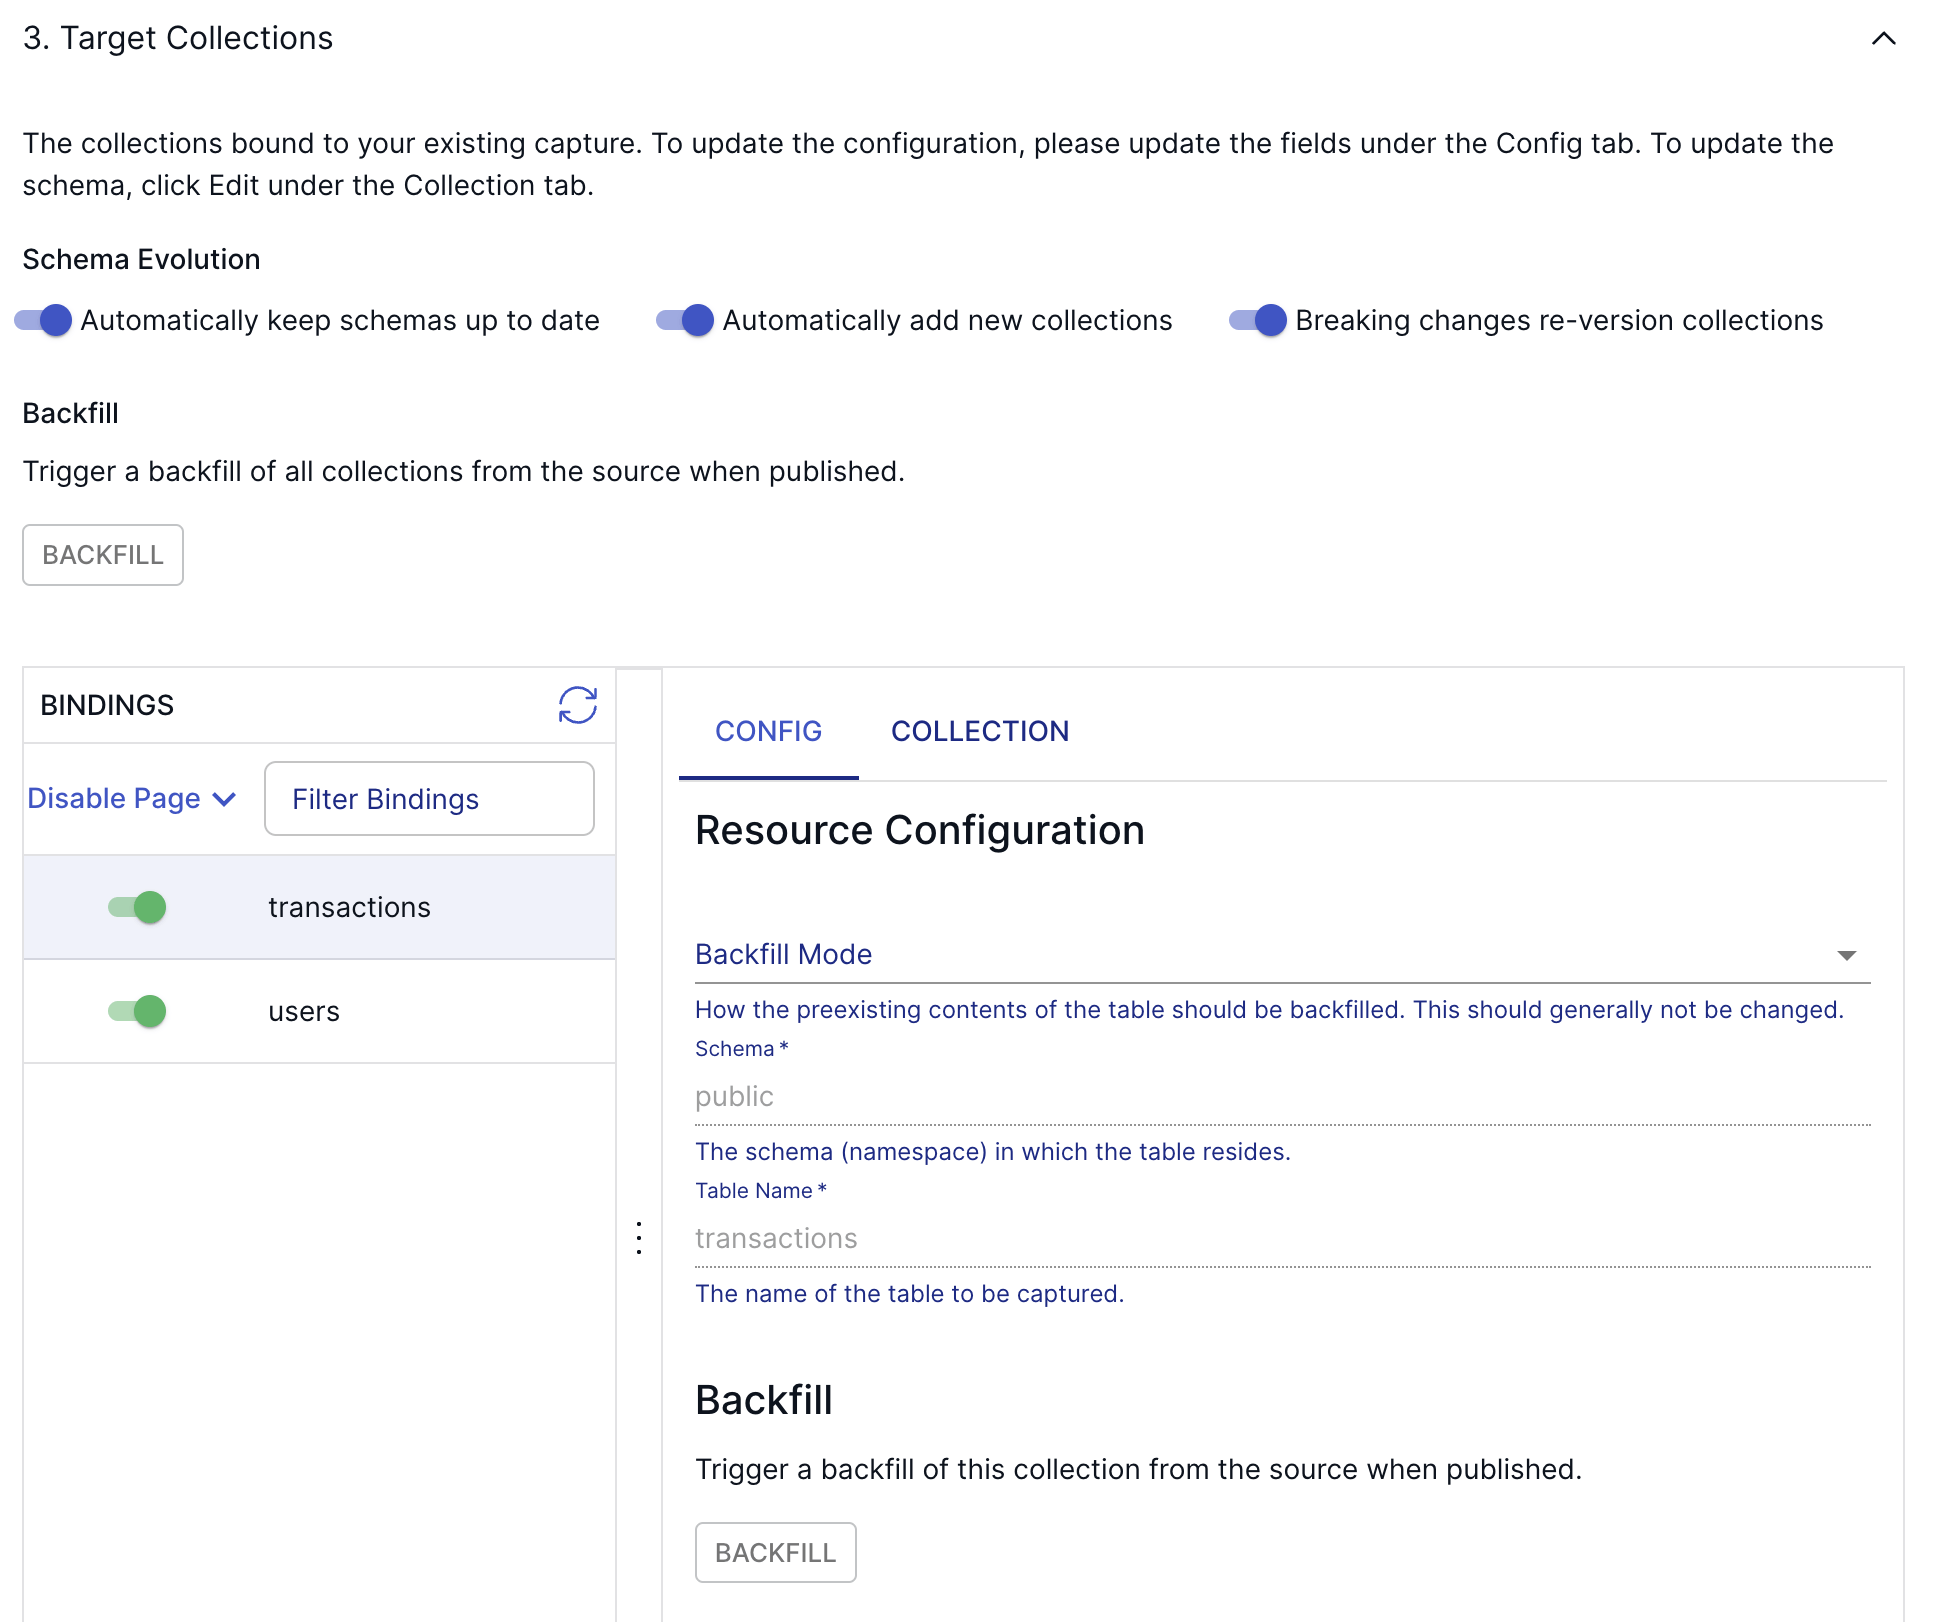
Estuary’s automated discovery process will identify the two tables and add them to the capture. Make sure both transactions and users bindings are present on the configuration page!
For the sake of this tutorial, feel free to leave everything at its default setting and press Next again, then Save and Publish to deploy the connector and kick off a backfill.
After the connector is successfully deployed, head over to the Collections page and take a look at the new transactions and users collections. This is where all change events captured by the connector coming from the source’s tables are going to land as documents. They both should have a few documents already available due to the automated backfill process.
The documents of your flows are stored in collections: real-time data lakes of JSON documents in cloud storage. Documents being backed by an object storage mean that once you start capturing data, you won’t have to worry about it not being available to replay – object stores such as S3 can be configured to cheaply store data forever. See docs page for more information.
Step 3: Putting the T in ELT with Databricks
Let’s set up the Databricks materialization, which will be responsible for loading these documents into Delta tables.
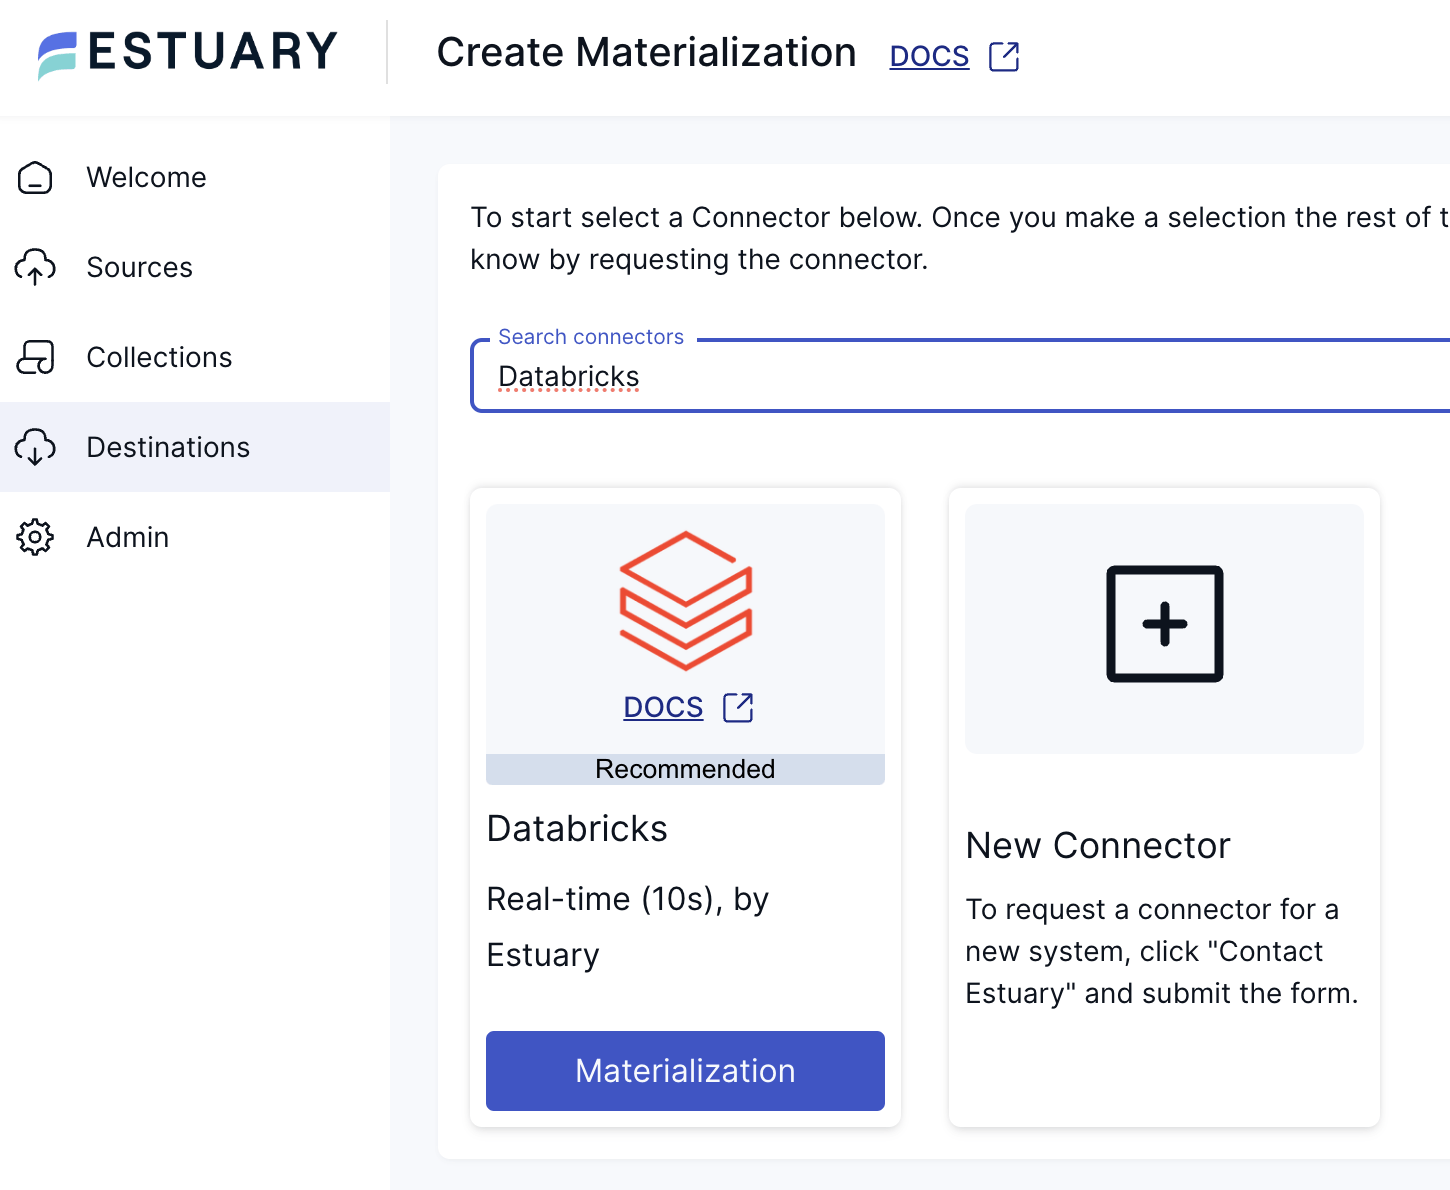
Head over to the Destinations page to create a new materialization and search for the Databricks connector.
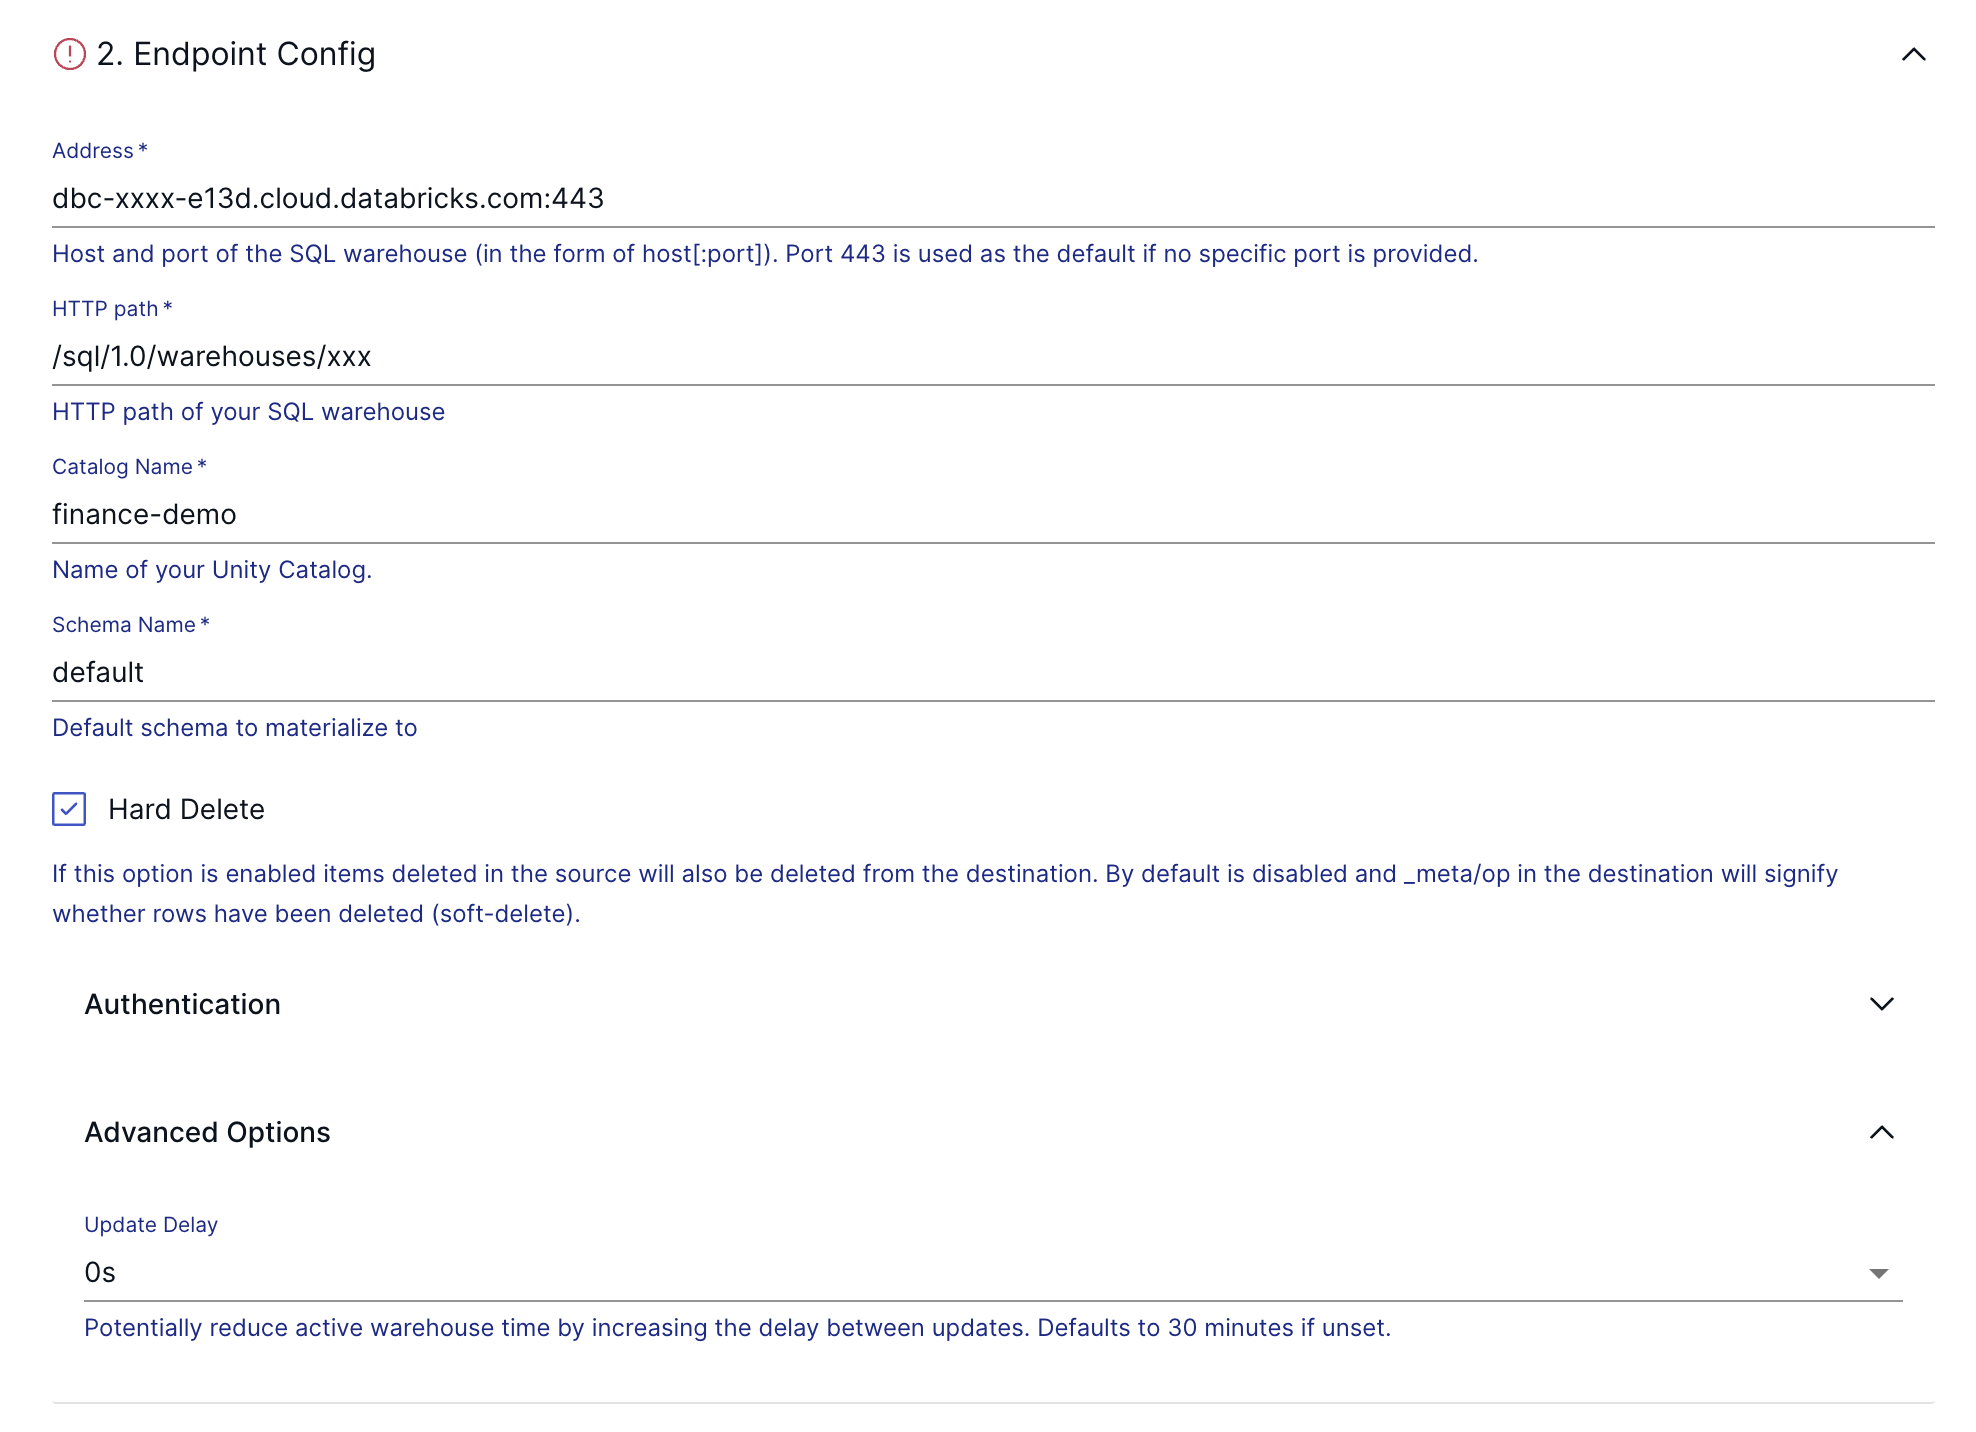
Press the “Materialization” button, and continue filling in the configuration details based on your Databricks environment.
Before using Estuarys's Databricks connector, ensure that you have created a SQL Warehouse in your account if you don't already have one. You can refer to the Databricks documentation for guidance on configuring a Databricks SQL Warehouse. Once the SQL Warehouse is created, you can locate the necessary connection details under the Connection Details tab.
To optimize costs, it is recommended to set the Auto Stop parameter for your SQL warehouse to the minimum available. The Databricks connector delays updates to the destination up to a configured Update Delay (refer to the endpoint configuration below) with a default value of 30 minutes. If the Auto Stop setting for your SQL warehouse is more than 15 minutes, the automatic delay is disabled as it is less effective in cost-saving with longer idle periods.
Additionally, you will need an access token for your user, which the connector will use. You can find guidance on creating an access token in the respective Databricks documentation.
Note that the configuration option “Hard Delete” is enabled in the screenshot above. This will cause the destination tables to be one-to-one replicas of the source tables, as the delete operations won’t appear as separate records. Instead, the connector will delete the records from Databricks if they were deleted from the source tables.
After all the details are in place, take a look at the Update Delay parameter.
The Update Delay parameter in Estuary materializations allows for flexible data ingestion scheduling. It determines the amount of time the system will wait before starting to materialize the most recent data.
For instance, if the update delay is set to 2 hours, the materialization task will wait for 2 hours before processing the latest available data. This delay ensures that the data is not immediately pulled in as soon as it becomes available. For this tutorial, let's set it to 0 seconds to showcase a real-time flow.
Click Next, then click Save and Publish in the top right corner to configure the materialization connector. Data from the collections should start materializing into Delta Lake in Databricks right away.
Delta Lake, an open-source storage layer, brings ACID (Atomicity, Consistency, Isolation, Durability) transactions to data workloads, ensuring reliability and performance, making it an ideal choice for managing large datasets.
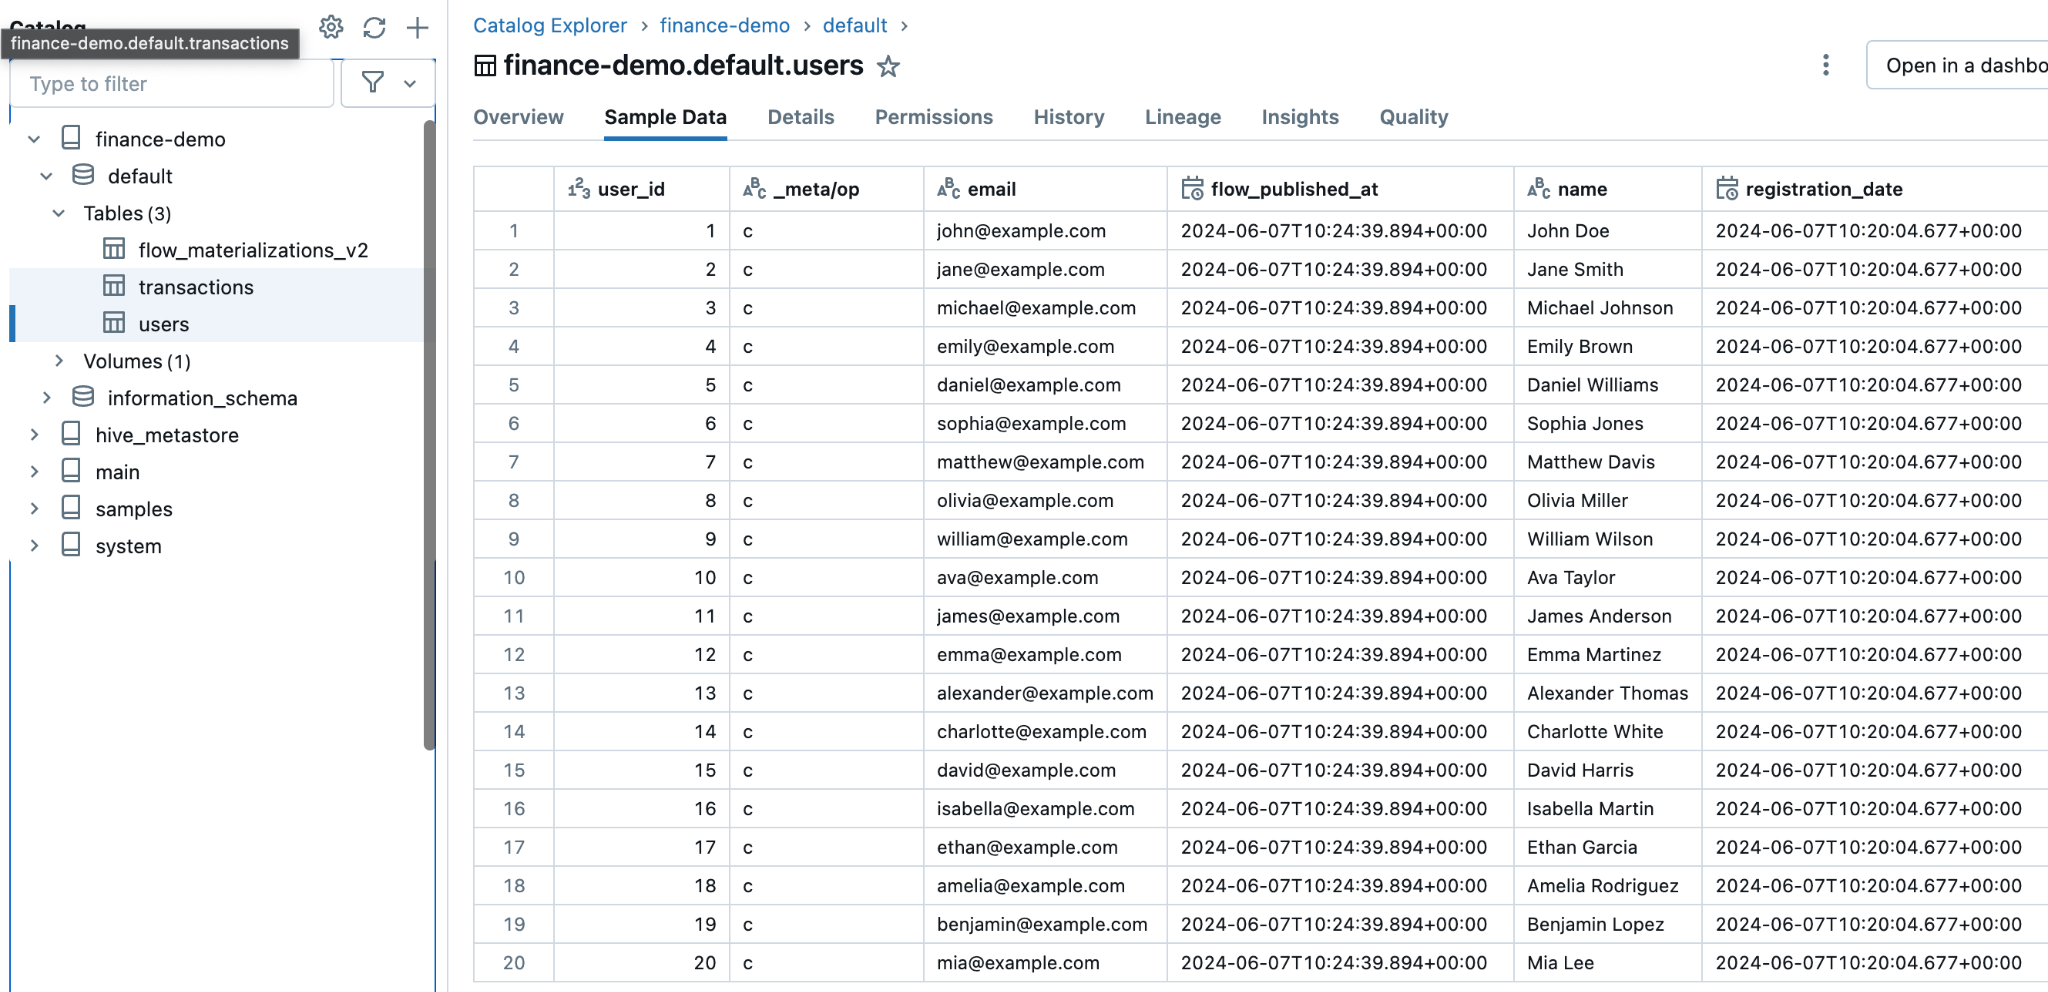
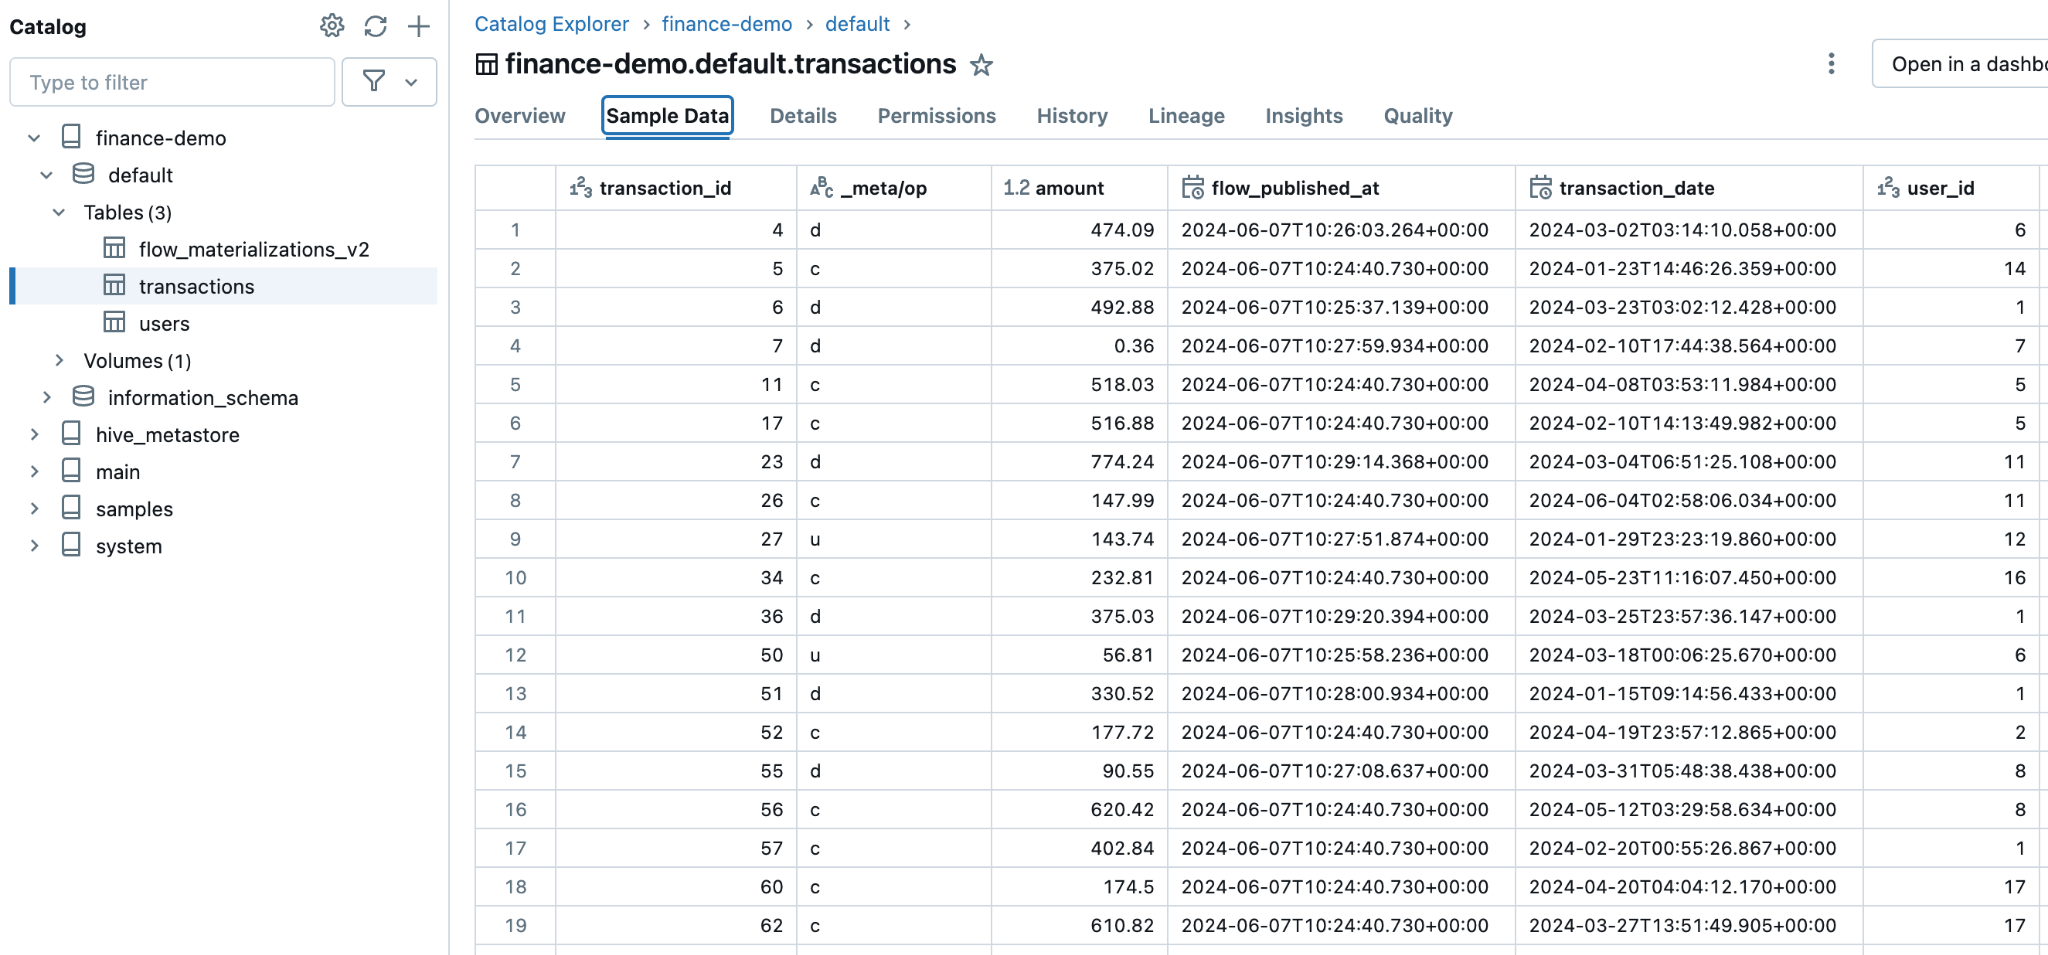
Estuary will create two tables.
Users:
Transactions:
Based on the configuration of the materialization connector, these tables will be updated as soon as data arrives in Estuary from PostgreSQL.
Now for the fraud detection part, you can start transforming this data with SQL:
plaintextWITH user_avg AS (
        SELECT
            user_id,
            AVG(amount) AS avg_amount
        FROM
            `finance-demo`.`default`.`transactions`
        GROUP BY
            user_id
    )
    SELECT
        t.transaction_id,
        t.user_id,
        t.amount,
        t.transaction_date,
        u.name,
        u.email,
        u.registration_date,
        CASE
            WHEN t.amount > ua.avg_amount * 3 THEN TRUE
            ELSE FALSE
        END AS is_anomaly,
        t.amount - ua.avg_amount AS amount_diff
    FROM
        `finance-demo`.`default`.`transactions` t
    JOIN
        `finance-demo`.`default`.`users` u ON t.user_id = u.user_id
    JOIN
        user_avg ua ON t.user_id = ua.user_id
This query detects transactions where the amount is significantly higher than the average transaction amount for a user, flagging potential anomalies. While not as sophisticated as a machine learning model, for this tutorial, it will do. If you execute the query you’ll see a boolean flag field called is_anomaly which you can use to create a dashboard. Everybody loves dashboards!
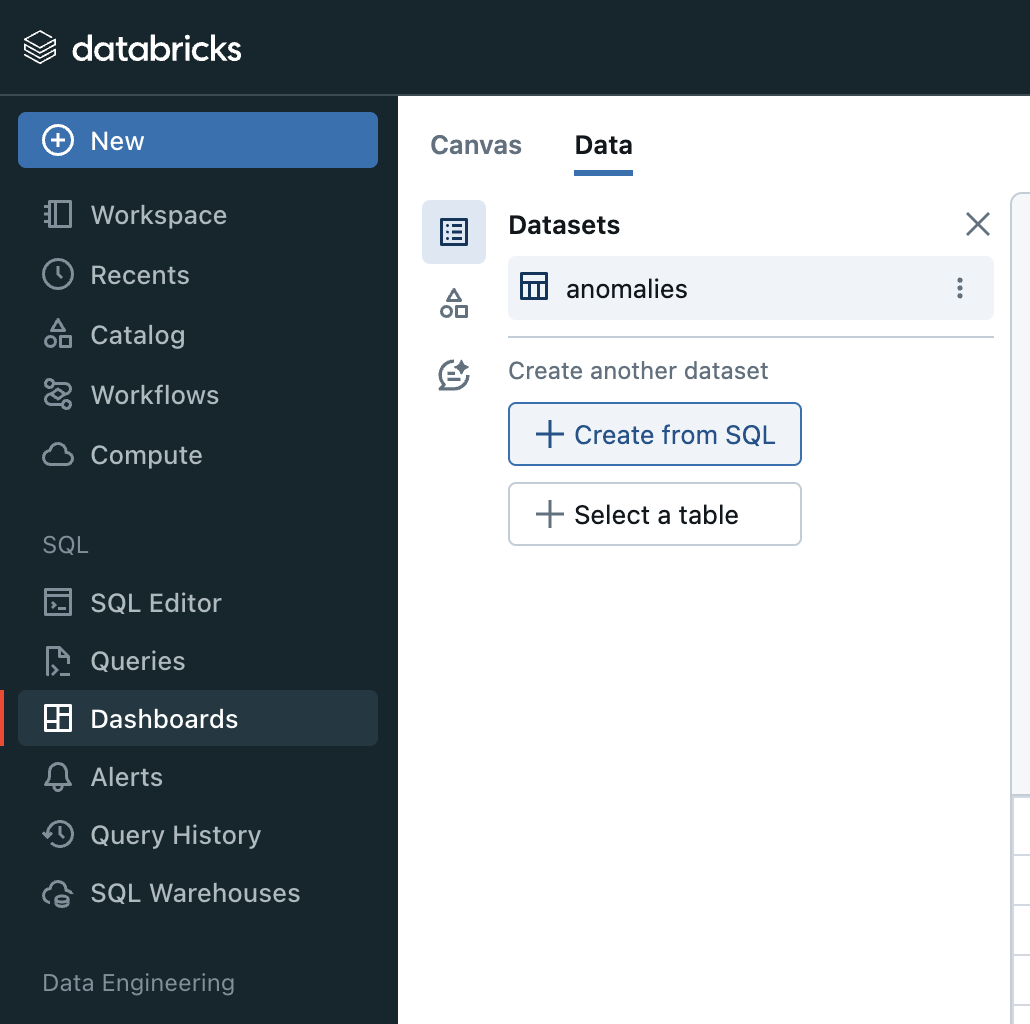
Head over to the Dashboard page in your Databricks console, and create a new chart from a SQL query. Use the query from above.
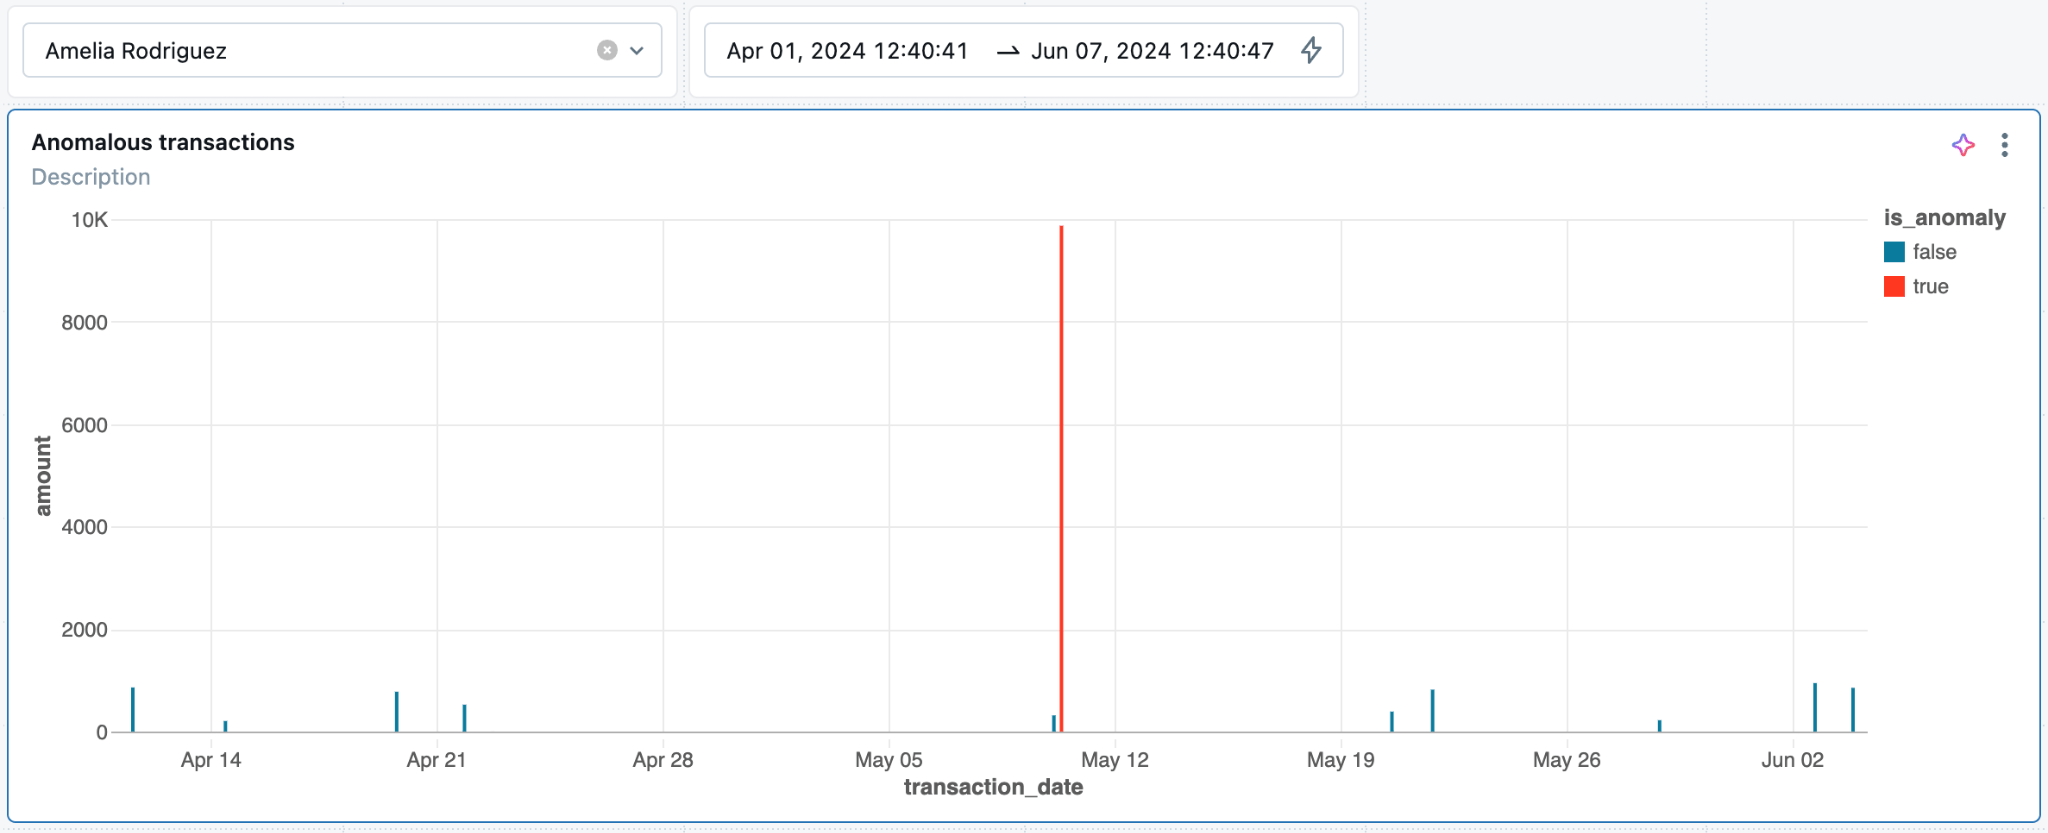
And finally, the fraud detection diagram:
As you can see, for this user, in the specified timeframe, the query detected one anomalous transaction, highlighted in red and noticeably larger than the other transaction amounts.
If you want to take it to the next level, check out Databricks AI functions - they allow you to write natural language queries over your data instead of having to come up with SQL!
Conclusion
By utilizing Estuary and Databricks, you leveraged the strengths of both platforms to establish a strong and efficient CDC pipeline. This integration enabled us to automate data ingestion and simplify transformations ultimately empowering more informed and timely business decisions.
We hope this tutorial has provided you with the knowledge and tools to implement your own CDC pipeline and leverage the full potential of Estuary and Databricks in your data transformation projects.
If you want to learn more, make sure you read through the Estuary documentation.
You’ll find instructions on how to use other connectors here. There are more tutorials here.
Also, don’t forget to join the Estuary Slack Community!

About the author
Dani is a data professional with a rich background in data engineering and real-time data platforms. At Estuary, Daniel focuses on promoting cutting-edge streaming solutions, helping to bridge the gap between technical innovation and developer adoption. With deep expertise in cloud-native and streaming technologies, Dani has successfully supported startups and enterprises in building robust data solutions.

