Every day, a massive amount of digital data is generated from various sources at an extraordinary speed. The gravity of this data can never be overstated. Not only it is important but utterly crucial for that competitive edge that businesses seek to thrive. But to get an in-depth understanding of this data, you need to interpret it which leads us to big data analytics.
Big data analytics offers the solution to this challenge that extracts meaningful insights from large and complex datasets. But that's easier said than done. As compelling as big data analytics might be, it presents its own struggles.
Dealing with the volume, velocity, and variety of big data requires sophisticated tools, technical acumen, and a well-defined strategy. Transforming the overwhelming data overflow into practical insights can seem like navigating through a dense jungle.
This is what our guide aims to do – demystify big data and big data analytics for you. We will cover everything from the types of big data to the workings of big data analytics, and talk about Estuary and how it can address the challenges of big data analytics.
By the end of this valuable read, you will have a thorough understanding of how big data analytics work and how you can put it to best use for optimal results.
What Is Big Data?
Big data refers to expansive and intricate datasets that are often derived from new sources. These datasets are so large that conventional data processing software struggles to handle them. The importance of big data lies not only in the type or the amount of data but also in how it is used for insights and analysis.
Before moving further, let’s talk about the most important characteristics of big data – the 5Vs of big data:
The 5 Vs Of Big Data
Let’s take a look at the 5 Vs and see how they contribute to the overall significance of big data:
Volume
It is defined as a massive amount of data coming from various sources, including financial transactions, IoT, social media networks, and industrial equipment. The data size can vary from terabytes to petabytes depending on the industry or application.
Velocity
This refers to how fast we get and use data. With the emergence of internet devices, tracking tags, sensors, and smart meters, data comes in and is used almost right away.
Variety
It relates to the wide range of data produced. Traditionally, data were structured and organized in relational databases. But big data can be structured, semi-structured, and unstructured. Also, it can be in the form of text, audio, or video, and require preprocessing to analyze.
Veracity
This represents the quality and reliability of the data. Big data often involves dealing with data from various sources which can have inconsistencies, inaccuracies, or biases. Ensuring data accuracy and addressing veracity challenges are crucial to maintaining the integrity of analyses and outcomes.
Value
This V represents the ultimate goal and significance of data analysis. It emphasizes the potential for extracting actionable insights that drive meaningful outcomes, innovation, and competitive advantage for businesses.
Now that we've explored the concept of big data, let's take a closer look at its different types to fully understand the diverse insights and opportunities that big data can offer.
Understanding The 3 Types Of Big Data
Here are the 3 major big data types:
Structured Data
Structured data is the set of information that follows a specific format or pattern. This data is uniformly arranged and allows computers to read, analyze, and understand it quickly. The advantages of structured data lie in its simplicity and systematic organization.
Examples of structured data include.
- Dates
- Names
- Addresses
- Geolocation
- Stock information
- Credit card numbers
Data engineers working with relational databases can easily input, search, and manipulate structured data using a relational database management system (RDBMS).
Unstructured Data
On the other hand, unstructured data doesn't conform to any specific layout. It's a broad category covering diverse types of information. Examples of unstructured data include.
- SMS
- Mobile activity
- Satellite imagery
- Audio/video files
- Social media posts
- Surveillance imagery
The wide-ranging nature of unstructured data makes it more complex to interpret. Non-relational/NoSQL databases and data lakes are better suited for managing unstructured data. These databases provide flexible storage and retrieval mechanisms that can handle the diverse and variable nature of unstructured data.
Semi-Structured Data
Semi-structured data occupies a middle ground between structured and unstructured data types. It shares characteristics of unstructured data but includes metadata that identifies specific attributes. The metadata enables more efficient cataloging, searching, and analysis compared to strictly unstructured data.
It doesn't have a specific relational data model but includes tags and semantic markers that scale data into records in a dataset. A few examples of semi-structured data are.
- XML
- Emails
- Web pages
- Zipped files
- TCP/IP packets
- Data integrated from different sources
Now that we've covered the 3 different types of big data, let's move on to understanding big data analytics. This part will help us grasp the practical side of things to see how we can make sense of all that data and use it to our advantage.
What Is Big Data Analytics?
Big data analytics is the process of extracting valuable insights, patterns, and correlations from large amounts of data to help in decision-making. This involves using statistical analysis techniques like clustering and regression and leveraging advanced tools to analyze vast datasets.
Big data analytics continues to evolve as data engineers explore ways to integrate complex information from sources like sensors, networks, transactions, and smart devices. Emerging technologies like machine learning are also being employed to uncover more intricate insights.
So why is big data analytics important? In short, it:
- Provides organizations with new insights to make informed decisions.
- Involves examining large data sets to uncover valuable information and patterns.
- Utilizes advanced analytics techniques like predictive models and statistical algorithms.
- Employs big data analytics tools and technologies to process and analyze massive amounts of data.
How Big Data Analytics Works?
Organizations gather data from various sources like social media, websites, and sensors. This data is then stored in a data warehouse for analysis where patterns and trends can be unveiled.
To make sense of the vast amount of data, businesses use dedicated software that cleans and organizes the data for effective analysis. This way, they identify patterns and correlations that would be otherwise challenging to detect using traditional methods. Once the data has been examined, you can use the findings to make better choices that are backed by information.
There are many steps involved in big data analytics. Let’s discuss them in detail.
Data Collection
The process of gathering data from various sources varies across companies with data collection often occurring in real-time or near real-time for immediate processing.
Modern technologies collect both structured (tabular formats) and unstructured raw data (diverse formats) from multiple sources like websites, mobile applications, databases, flat files, CRMs, and IoT sensors.
Data Storage
The collected data is then stored in a distributed file system like HDFS (Hadoop Distributed File System). By using a distributed file system, you can efficiently manage and analyze large volumes of data in parallel – thanks to the combined computational power of multiple machines.
This distributed approach to data storage enables faster processing and scalability which makes it ideal for handling big data workloads effectively. Raw and unstructured data, because of their complex nature, sometimes require a different approach. This data type is assigned metadata and stored in data lakes.
Data Processing
The stored data needs to be transformed into understandable formats to generate insights from different queries. To achieve this, various data processing options are available. The choice of approach depends on the computational and analytical requirements, as well as available resources.
Big data processing can be classified based on the processing environment and processing time.
According to the processing environment, data processing can be categorized into:
Centralized Processing
In this, all data processing occurs on a single dedicated server. This setup allows multiple users to share resources and access data simultaneously. This type of data processing poses risks as a single point of failure can result in the entire system going down. So special precautions should be taken to avoid any disruptions in the system.
Distributed Processing
This type deals with large datasets that cannot be processed on a single machine. It divides large datasets into smaller segments and distributes them across multiple servers. This approach maximizes efficiency as well as offers high fault tolerance.
On the other hand, based on processing time, big data processing can be categorized into:
Batch Processing
This category involves processing data in batches during a time when computational resources are available. It is preferred when accuracy is primary.
Real-Time Processing
This approach processes and updates data in real time within a short span. It is a great option for applications where quick decisions are important.
Data Analysis
The next step in big data analytics is data analysis. Several advanced techniques and practices are used to convert the data into invaluable insights. A few common ones are:
- Text/Data mining helps extract insights from large volumes of textual data like emails, tweets, research papers, and blog posts.
- Natural language processing (NLP) enables computers to comprehend and interact with human language in text and spoken forms.
- Outlier analysis is used to identify data points and events that deviate from the rest of the data. This method finds application in activities like fraud detection.
- Predictive analytics analyzes past data to make forecasts and predictions about future outcomes. This technique helps identify potential risks and opportunities.
- Sensor data analysis involves analyzing big data constantly generated by various sensors installed on physical objects like IoT devices, industrial sensors, and healthcare devices.
How Can Estuary Help In Simplifying & Accelerating Big Data Processing?
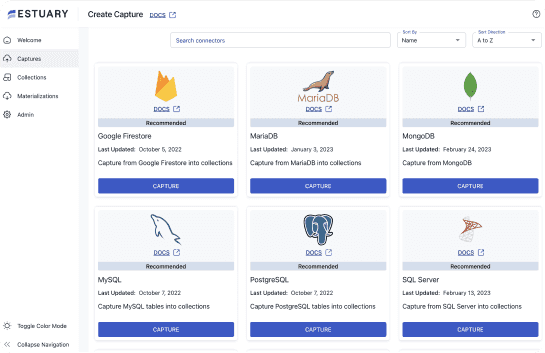
To effectively analyze big data, you need a platform that ensures that you have the most up-to-date data available at all times. This is where real-time data pipeline solutions like Estuary Flow can help. Flow employs an event-driven runtime that offers true real-time change data capture, outpacing traditional ETL platforms. Here are some key differentiators of Estuary Flow:
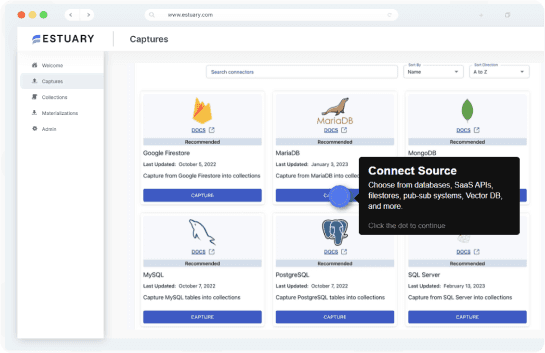
- Flow can connect with your databases and SaaS applications, capturing data in real time at a rate of 7GB/s. It also scales with the incoming data.
- Flow can materialize — or write — data to data warehouses like BigQuery, Snowflake, and Redshift within milliseconds of its appearance at the source.
- With Estuary Flow, you get accurate data without duplicates. It also comes with built-in testing for data accuracy and robust resilience across regions and data centers.
- Extract, transform, and load (ETL) is a major component of big data analytics as it combines data from multiple sources, and cleans and organizes for storage. Estuary Flow provides a streaming ETL solution for data ingesting and integrating data.
- Flow provides monitoring and up-to-the-minute reporting of your live data which can help in course correction.
- Estuary Flow offers schema inference that saves time and effort in understanding the structures of the data. It also helps in converting unstructured data into structured data for convenient handling.
5 Applications Of Big Data Analytics In Real Life
Now let's explore the applications of big data analytics and see why big data analytics is important.
eCommerce & Retail
Big data analytics is used in the eCommerce and retail sectors to enhance customer experience and boost sales. It helps analyze customer data, including their purchase history and browsing behavior, and provides personalized recommendations. It also helps in marketing campaigns and targeted offerings.
Amazon Uses Big Data Analytics For Best-In-Class Customer Satisfaction
For example, Amazon uses big data analytics to enhance the shopping experience of customers. By analyzing their data, Amazon gains insights into each user which it uses to tailor and deliver more personalized advertising campaigns. Some other areas where Amazon uses big data analytics are:
- Demand forecasting
- Customer segmentation
- Alexa and voice analytics
- Supply chain optimization
- Pricing and dynamic pricing
- Fraud detection and prevention
- Personalized recommendations
Healthcare
In the healthcare industry, big data analytics plays a vital role in enhancing patient care. It can be used to analyze patient data, including medical history, demographics, and treatment outcomes, helping healthcare providers to identify crucial medical patterns.
More specifically, it can identify risk factors and make treatment plans that fit each patient's needs. Big data analytics helps healthcare workers make better choices and lets them give more personalized and effective care to their patients.
An MIT Startup Utilizes Big Data Analytics For Mental Healthcare
Ginger.io, a startup, utilizes machine learning and big data from smartphones to remotely predict mental health symptoms. The mobile app not only provides chat options with medical therapists and coaches but also allows healthcare professionals to gather and analyze behavioral data for effective care.
The app tracks messaging frequency, phone calls, sleep patterns, and exercise habits, to detect any deviated pattern. For instance, decreased communication may indicate depressive episodes while an increase in calls and messages could suggest manic episodes in patients with bipolar disorder.
Energy
In the energy industry, big data analytics plays an important role in optimizing energy generation, transmission, and distribution systems. Utility companies analyze data from smart meters and generators to gain insights into energy production and usage patterns. They can use this information to improve system efficiencies and resource allocation.
GE Uses Big Data Analytics To Monitor Its Wind Farm
GE wind turbines incorporate around 50 sensors that constantly transmit operational data to the cloud. This data is then utilized to optimize turbine blade direction and pitch, maximizing energy capture. It also enables the site operations team to monitor the health and performance of each turbine.
Finance
Big data analytics is an important tool in the financial industry for identifying trends, detecting fraud, and developing new financial products. By analyzing vast amounts of financial data, including stock prices and market movements, organizations gain valuable insights to help mitigate risks and enhance financial security.
American Express Uses Big Data Analytics For Fraud Protection & Risk Management
American Express relies on Big Data analytics to drive its decision-making process. It has a strong focus on cybersecurity and the company has developed a machine-learning model that analyzes various data types to prevent credit card fraud in real time. It continuously monitors and analyzes data to ensure the financial security of its customers and effectively combat fraudulent activities.
Manufacturing
Big data analytics is also used in the modern manufacturing industry. It plays a vital role in enhancing efficiency and minimizing costs. By analyzing data collected from sensors on factory equipment, potential maintenance issues can be identified in advance and avoid escalation.
This proactive approach helps streamline operations, reduce downtime, and optimize production processes. By utilizing the power of data, manufacturers can implement predictive maintenance strategies and ultimately improve overall operational performance.
KIA Motors Uses Big Data Analytics For Quality Control & Predictive Maintenance
Big Data analytics plays a crucial role in KIA Motors' quality control processes. By monitoring sensor data and performance metrics from vehicles, KIA can identify patterns and anomalies that indicate potential issues or maintenance needs. This proactive approach enables timely maintenance and reduces the risk of unexpected breakdowns or costly repairs.
Big Data analytics also helps KIA Motors optimize its supply chain operations by analyzing various factors, including inventory levels, demand forecasts, production schedules, and logistics data. This way, KIA streamlines its supply chain, reduces costs, improves delivery times, and enhances overall operational efficiency.
Conclusion
The applications of big data analytics are far-reaching and diverse. From personalized recommendations and demand forecasting to fraud detection and supply chain optimization, the impact of Big Data analytics spreads through numerous industries.
The importance of different types of data, whether structured, unstructured, or semi-structured, highlights the need for advanced tools that can handle and analyze all of it effectively. In this complex environment, Estuary Flow can make all the difference between success and failure.
With its ability to integrate diverse data sources and extract valuable insights in real time, Flow empowers you to handle vast amounts of data effectively. So if you are looking to harness the power of big data analytics for your data-driven journey, Estuary Flow is an excellent place to start. Sign up for Estuary Flow for free and explore its many benefits, or contact our team for more information.

About the author
With over 15 years in data engineering, a seasoned expert in driving growth for early-stage data companies, focusing on strategies that attract customers and users. Extensive writing provides insights to help companies scale efficiently and effectively in an evolving data landscape.


